Monthly Archives

January 2014

Wind Sensor Development

By Blog

Design and development of the wind sensor WSD‑1 has been an interesting journey. The design was started in January 2013, and the first production run was ordered in January 2014. Several design iterations have been produced. Along the way, several images and videos have been captured.

A few of these have been combined into the following short video presentation:

Eugene

Winter Tripod Setup

By Blog

We spent a few minutes in the snow filming the setup of the tripod. In spite of the ice that froze the warm aluminum components when they were dropped in the snow, the tripod went together smoothly.

The demonstration showed what we expected to be true, which is that the tripod can be fully erected with gloved hands, with the exception of the guy cable clips.

The short and long versions are on the Dyacon YouTube site and the product page.

Stay warm.

Eugene

Frosty Wind Sensors

By Blog

Getting field time for the wind sensors has been a priority from the beginning of the design effort. The following images are a collection of how they fare in some of the cold and snowy conditions.

The first image shows several design variants. The red one was the first design. Drip edges were introduced in the next iteration. The vane fin and anemometer cups were initially 3D printed. A number of cup designs were tested before tooling the injection mold.

Three wind sensor variants.

Three WSD variants on the test mast.

Three WSD variants with snow.

Three WSD variants with snow.

WSD-1 head on w/ snow.

WSD-1 head on w/ snow.

Several cold, dark, and foggy days led to an accumulation of frost. A slight breeze was just enough to turn the cups but not dislodge the ice crystals.

Frosty anemometer and vane are still operational.

Frosty anemometer and vane are still operational.

Snow is always a challenge.

Snow accumulation on solar panel.

Snow accumulation on solar panel.

Snow accumulation melts off a bit.

Snow accumulation melts off a bit.

Snowed in wind sensors did not freeze. The still morning air gave way an hour later, and the cups then turned freely.

Not frozen, just snowed in due to still air.

Not frozen, just snowed in due to still air.

Wind Tunnel Testing

By Blog

With all the time and care we put into their existence, each of our products quickly becomes our “baby.” It’s hard to abuse something so near and dear, but for product designers like me, this type of testing is necessary. We did a couple of rounds of wind tunnel testing on a WSD-1 (the Dyacon wind sensor) using an ELD wind tunnel with an 18″ square test chamber. We tested the sensor up to 60 m/s (134 mph, 215 kph).

Tests were structured around ISO 17713‑1. The tests conducted were:
– Starting threshold
– Transfer function
– Distance constant
– Off-axis response ratio

The ISO 17713‑1 tests were adapted to meet the digital output characteristics of WSD‑1. Additional testing at an independent lab is planned.

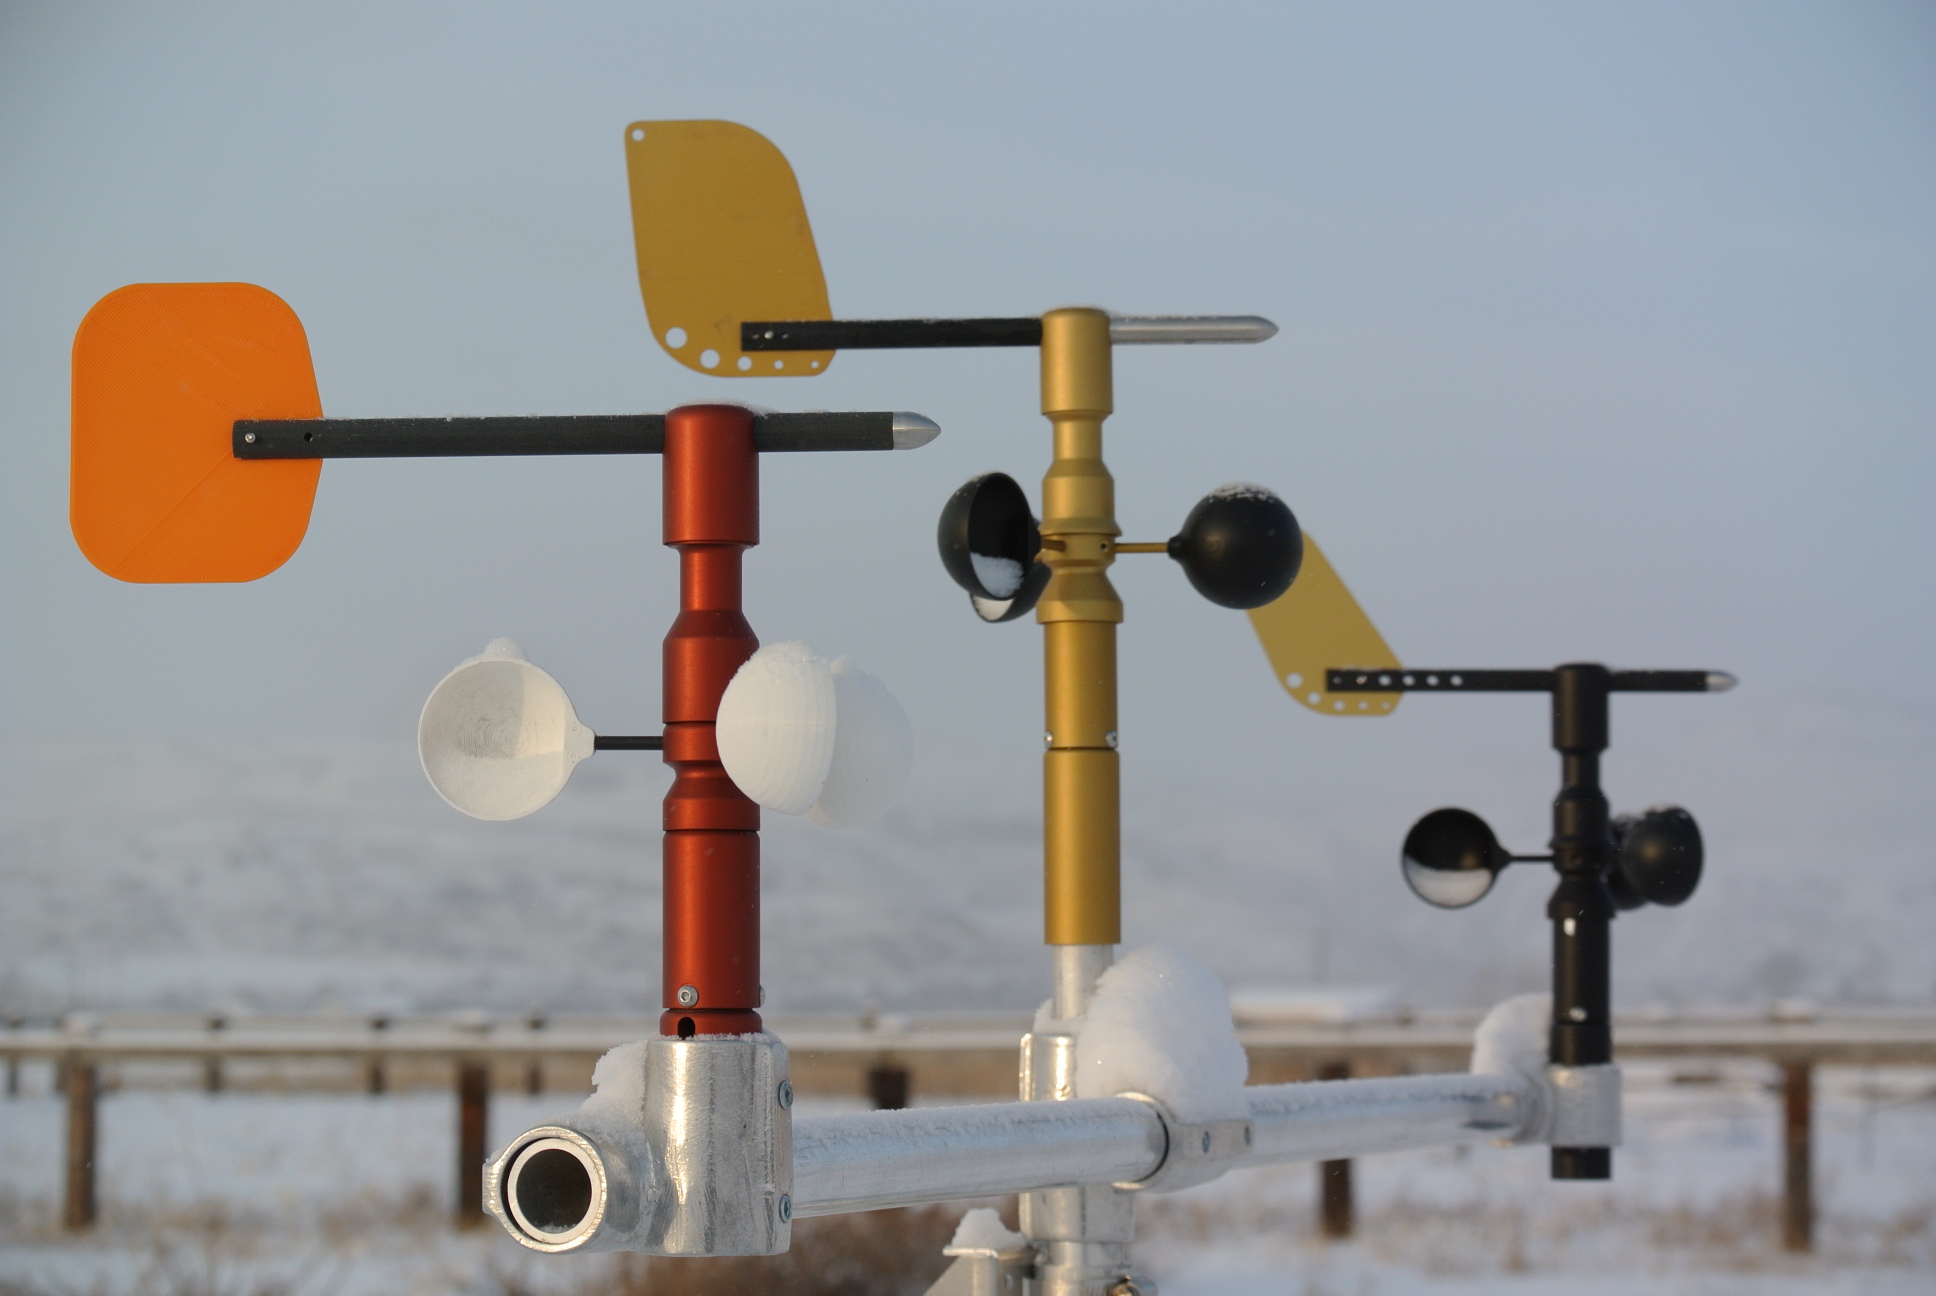
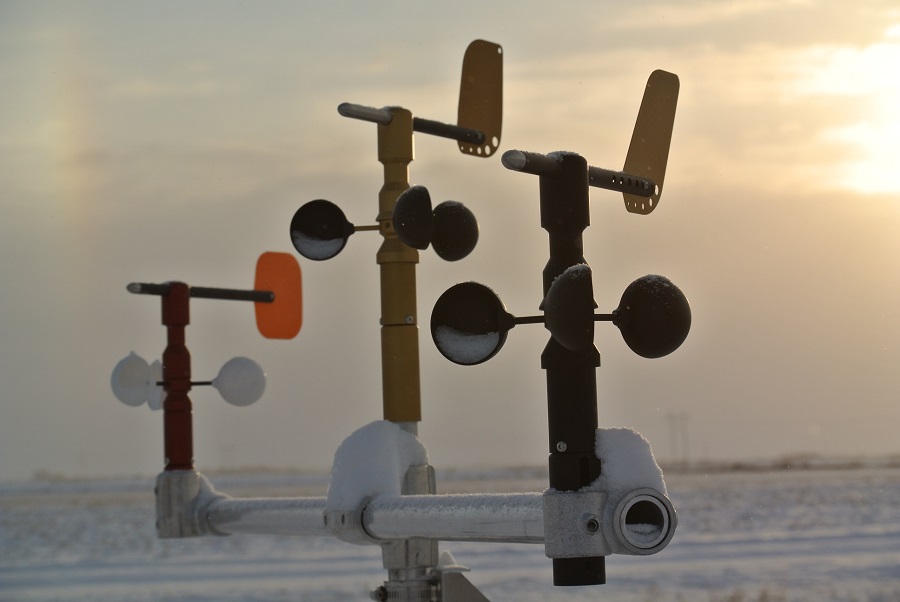
The following are some images from the effort:

Wind sensor in tunnel

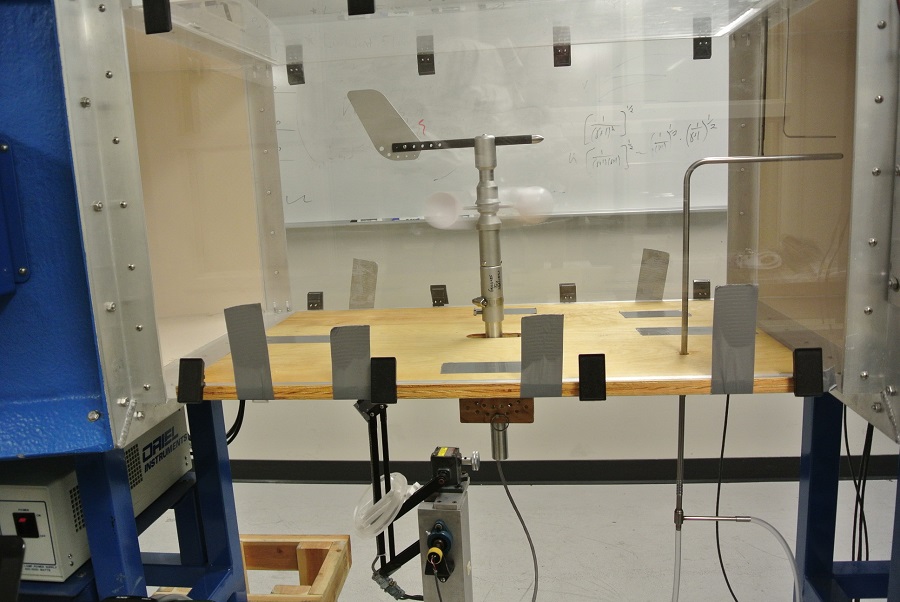
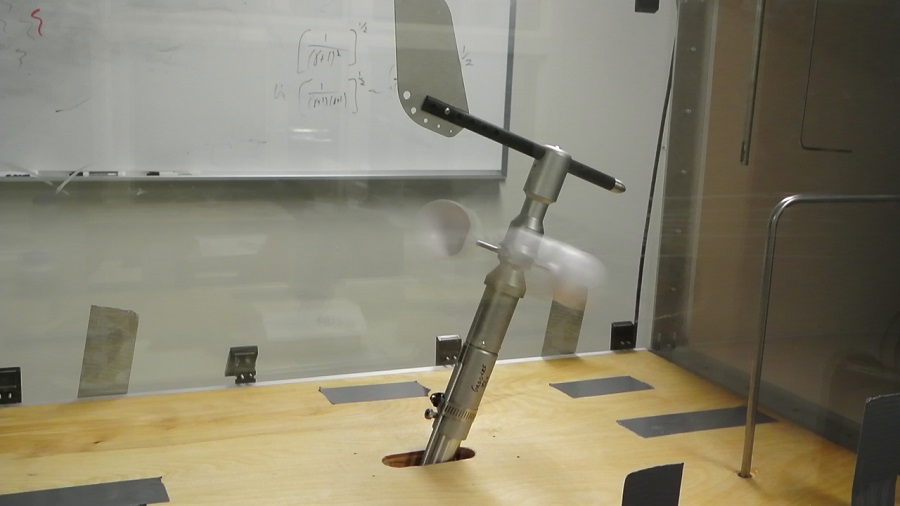
Wind sensor in wind tunnel test section

A computer is used to capture the raw RS‑485 data during testing. These data will then be used by the firmware to calculate wind speed and direction for the Modbus data frame.

Wind sensor in test section and computer

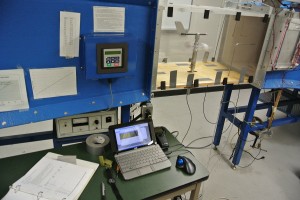
Computer used to capture RS485 data.

The test section floor and sensor mount allow the sensor to be tilted at 5 degree increments to a maximum incline of 30 degrees forward and back.

Wind sensor off-axis response test

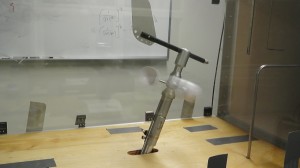
Off-axis response test

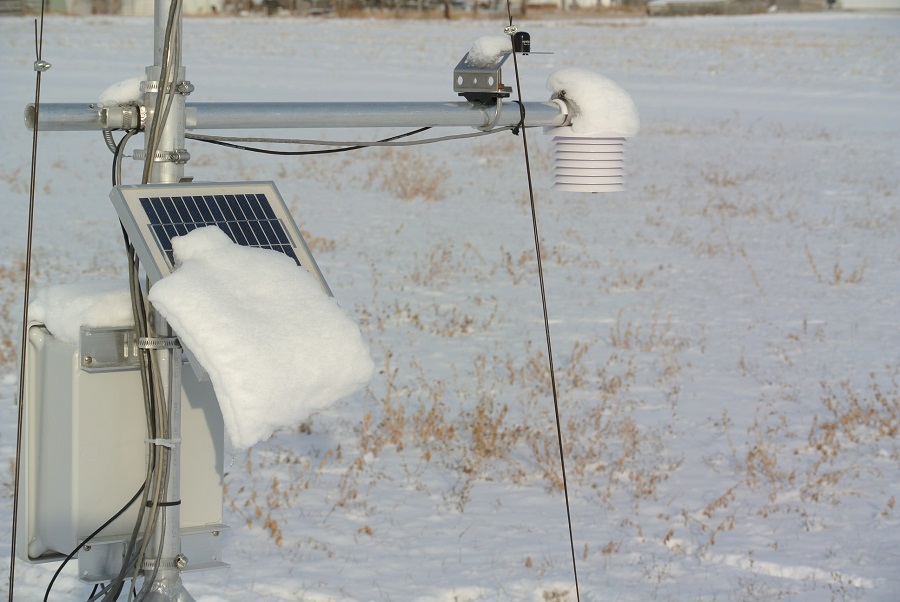
How do you abuse a sensitive wind sensor? Mount it to your truck. Rain, snow, dust, salt spray, vibration, gusts, tree branches, and overhead structures have all been encountered. The sensor pictured has racked up more than 5,000 highway miles at road speeds up to 80 mph (128 kph). A sensor like this on your truck is enough to make you the envy of every geek on the road.

Truck with wind sensor mounted

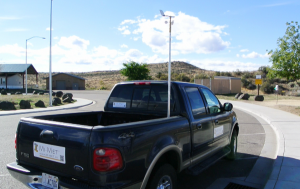
Truck with wind sensor mounted.

Drive safe.

Eugene