Monthly Archives

June 2019

Infrared Temperature Sensor

By Blog No Comments

*NOTE: This blog post is out of date. Some information may no longer be relevant.*

We are always working on one development or another, whether DyaconLive, new sensors, new [secret stuff], or expanding the capabilities of existing weather station capabilities.

Recently, we were contacted by an organization that needed a reasonable cost solution for a heat-island study. The goal was to collect baseline pavement surface temperature this year, apply new surface treatment, and then measure the difference next summer. The system had to provide real-time data to a web portal as well as local data logging.

So, we went to work; leveraging our CM-1 weather station controller and DyaconLive in order to deliver the functionality required in the short time frame.

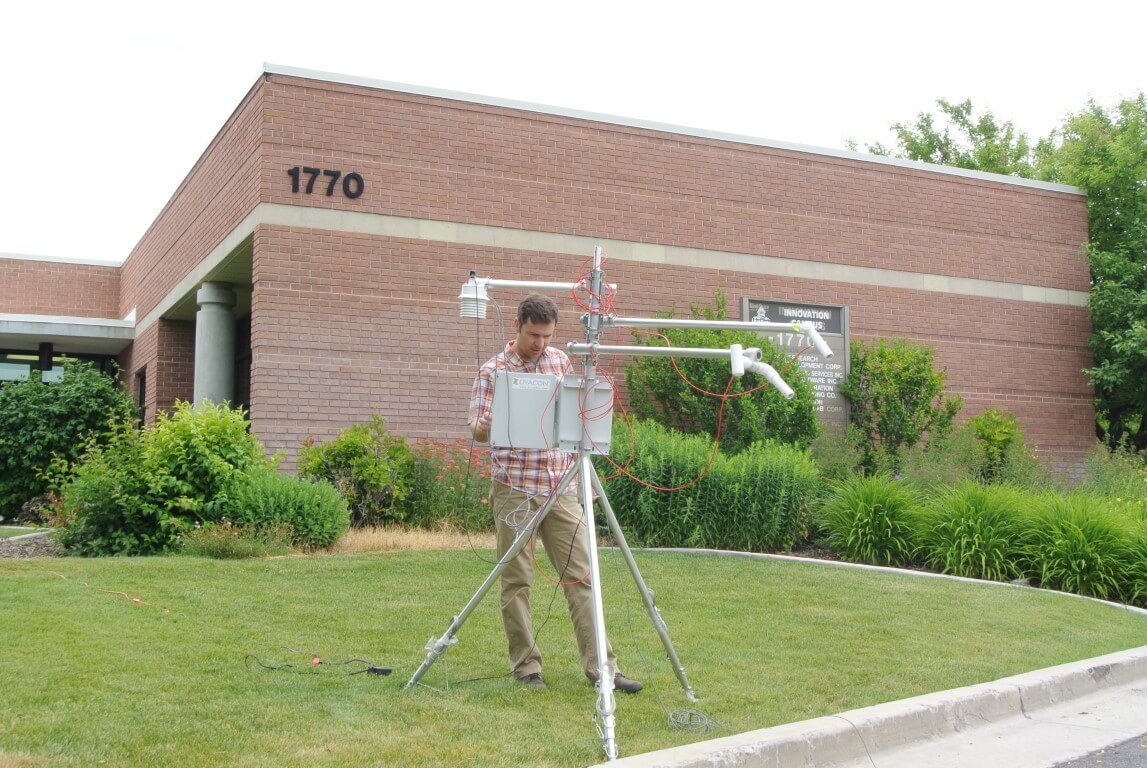
First Test Of Infrared Thermometer

It’s always fun cobbling together the first system and giving it a spin. Often we are enamored by its inelegance. As the images attest, this is definitely not elegant. But, that comes with time. At this stage, the data is most important; and, Chris, our staff scientist, is whiz at collecting data and building scripts for analysis.

Infrared Thermometer Applications

In addition to the heat-island study at hand, there are a number of applications that we can see for this new device.

Sub-surface temperature modeling

Foliage and crop canopy temperature

Ground temperature

Road surface temperature

Race track temperature

Roof temperature

Storage tank surface temperature

Outdoor sport court temperature

I’ll leave you to come up with more applications for an infrared temperature sensor for your business. Give us a call if you want to explore anything in particular.

The measurement temperature range of this device is -20 °C to 1000°C (-4° to 1830°F), which is quite a spread. While the maximum temperature is inadequate for plasma furnaces, it is high enough to monitor your local lava flow.

Please check back later. I’ll add more to this post as we make progress toward product release in August.

Eugene

Weather station data to cell phone

DyaconLive Growers Report

By Blog One Comment

DyaconLive provides our customers with an easy to use website for staying up to date with current weather conditions and makes it easy to download historical station data. However, we know that for many applications weather data is just the first component of more in depth analysis. Indeed, the key value provided by a station may not necessarily be the raw measurements, but rather the derived quantities that can provide actionable information. The question a business owner faces might not be “What is the temperature?” but rather “What is the trend in average temperature?”.

At Dyacon, we strive to facilitate this need for actionable insights. As part of this effort, we are introducing DyaconLive Reports. These are application-specific reports that are downloaded from DyaconLive and provide sophisticated data analysis in a user friendly interface.

One of the reports now available on DyaconLive is a “Grower’s Report”. This report is specifically targeted at agricultural producers and helps monitor crop growth by calculating Growing Degree Days (GDD) (https://en.wikipedia.org/wiki/Growing_degree-day). GDDs are calculated from air temperature measurements above (or sometimes below) a certain threshold.

Mathematically:

This equation is often simplified by using daily max/min values. Temperature is an important factor in plant and insect growth, so GDDs provide a means of evaluating when a particular crop or insect will reach maturity. This helps grower’s anticipate problems and plan for harvest.

The figure below shows a typical Grower’s Report for one of Dyacon’s test stations in Logan, Utah. The key components of the report, common in many different reports, are highlighted yellow. Near the top is an overview of station metadata and the dates associated with the output. A data quality assessment table is displayed next to the station table, and this is arguably one of the most important components of any report. Without good quality input data, the report output is meaningless. Input data quality is assessed automatically by the DyaconLive server when the report is generated. Measurements are assessed for reasonableness in terms of data values, behavior, and in some cases consistency with other measurements. The details behind these algorithms will be discussed further in a future blog.


The main output of the report consists of a summary table detailing settings and totals, and interactive charts for visualizing report output. The Grower’s Report charts temperature over the report timeframe and shows where the GDD threshold is located relative the temperature measurements. The GDD chart shows accumulated GDD and how it is changing through time. Users can assess current GDD values to determine how their crop is maturing.

Weather Station Requirements

  • Temperature
  • DyaconLive connection

Compatible Dyacon Weather Stations: MS-120, MS-130, MS-135, MS-140, MS-150

The only measurement required for this report is air temperature, which should be present on all Dyacon meteorological stations. It is worth noting that other reports will require a wider variety of instruments not present on every station.

How To Generate Your Report

Report generation currently requires Manager or Admin level access to DyaconLive.

  • Log in and navigate to the “Reports” section of the Data Page for your station.
  • Select a start date, temperature threshold, and temperature units.
  • Select ‘Generate Report’ and the report will be displayed in the browser.

Chris Cox