Read part 1 here. Updates are being made to as quickly as we can get them out.
Update: 10 July 2018
The work goes on to make DyaconLive more and more useful. Two table options were added to DyaconLive with the July release, a daily summary table and an aviation advisory table. One of these will be enabled on your login depending on the function of the weather station.
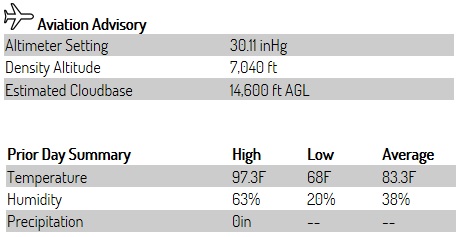
Last Observation is now give as an age rather than a date. This makes it more intuitive for users to see how old the data is.
We have also rearranged the dashboard to make room for the new table and improve readability. The new dashboard looks beautiful.

Update: 29 June 2018
One of the features we have added to DyaconLive is the option to set alarms based on instrument conditions.
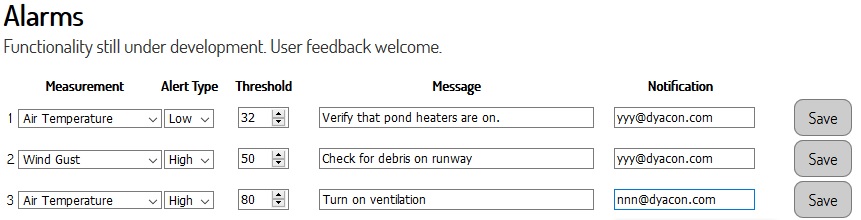
Users can not only set the value, but can also specify instructions and a specific email recipient.
Are there any conditions for which you would like to receive alerts? Dewpoint, heat index, cloud base? Let us know.
Update: 29 March 2018
Chris and Eric released a new version of DyaconLive. The coolest part is the weather station status page that charts the battery voltage, solar panel voltage, and charger state. This gives users an excellent tool to evaluate battery condition. (You have to be the station admin user to see this, it doesn’t show up on the public link.)
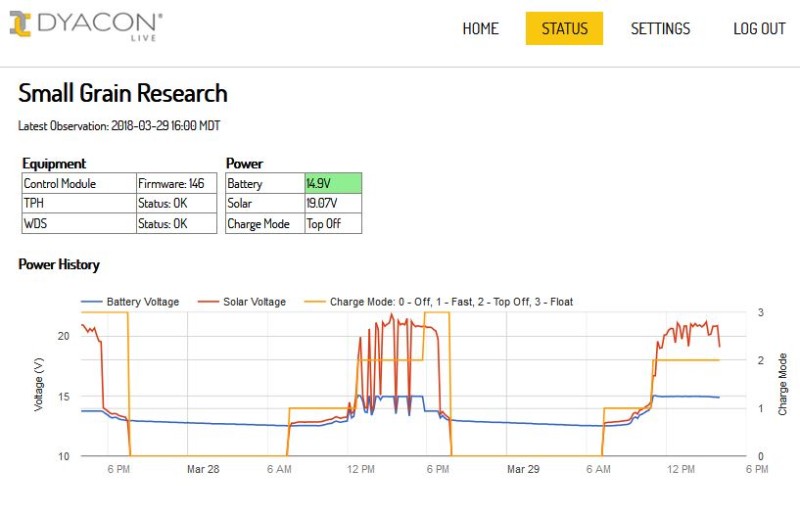
Dyacon Weather Station Battery Status
Update: 30 April 2018
There has been a lot of work behind the scenes that will help us expand the features and capabilities of the site as well as additions to the front-end of DyaconLive.
Radio Signal Strength Added
Station Status page now includes cell phone signal strength chart to help admin users manage the equipment and location.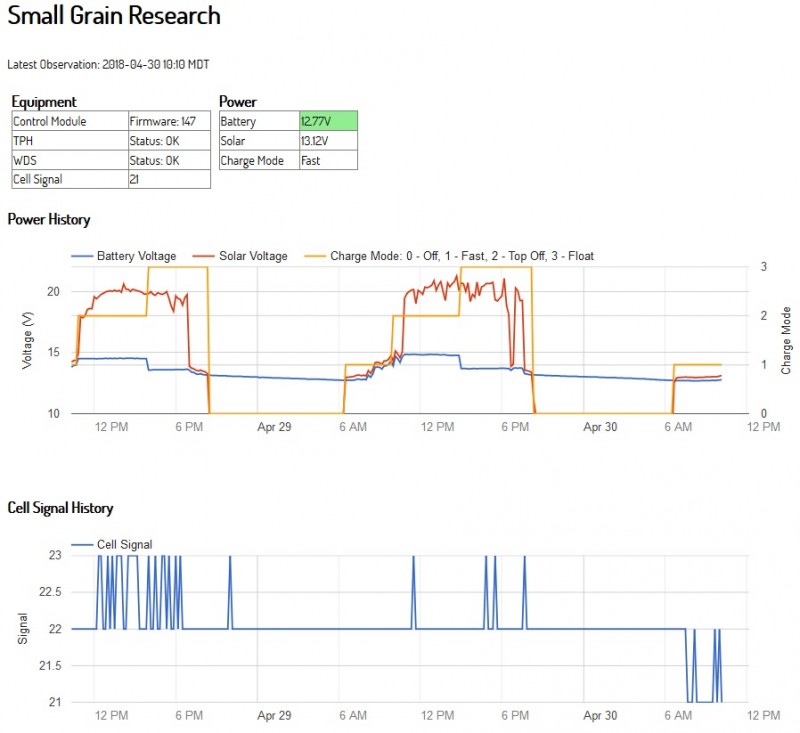
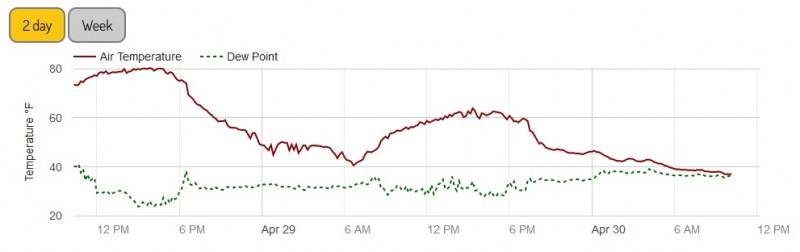
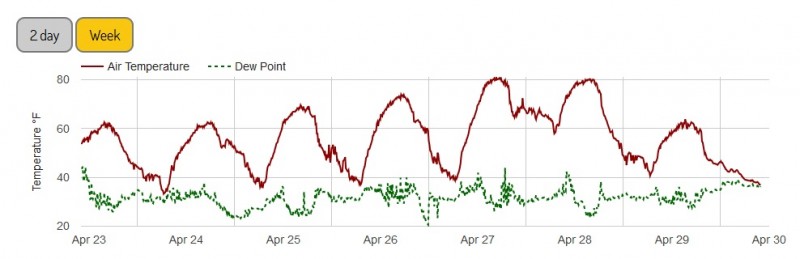
Chart Range Selection
The charting page allows users to select 2-day or 1 Week of chart span. Custom date range selection is coming soon.
2 Day Chart
Or…
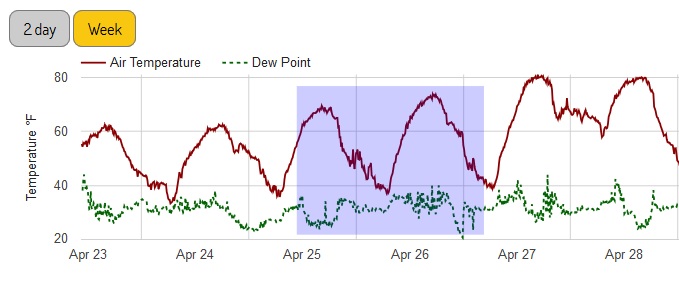
Drag Zoom
Even when displaying a week of data, users can zoom in on the chart by a left-click and drag selection box.
Zoom-in view.
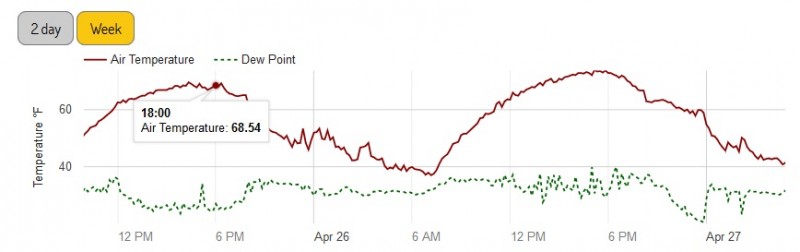
Simply right click to return to the normal view.
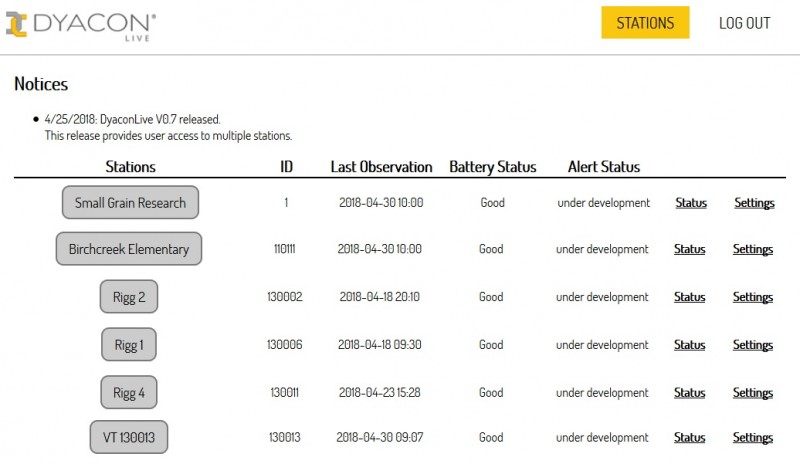
For Station Network Users
For users that have multiple weather stations, we now have a multi-station selection page.
Work is ongoing and many new features will soon be available.
Eugene
Join the discussion One Comment