Category

Blog

DyaconLive White Label

DyaconLive White Label Network Page

By Blog No Comments

Users that sign into DyaconLive as an Admin, Manager, or Basic user will have a list of stations presented which have been assigned to them.

Standard Weather Station User List

But, most DyaconLive users are public, meaning that the station admin has enabled the public link.

Weather Station Public Link Enable Checkbox

While functional, we now have a much better option: a white label network page.

The top-right logo area can be changed for your organization logo.

Each of the weather stations in your networks shows up on the map. Or, we can set a custom zoom so that only part of you network is visible when it first opens.

DyaconLive White Label Map

Each weather station in your network is listed to the right, with the time of the last observation. Clicking on the map location or station button will immediately take you to the weather station page.

Click here for Dyacon Test Station Network.

This is the first release of the network page. Improvements are coming.

If you are one of the current DyaconLive users with multiple weather stations, give us a call and we can explain the options.

Eugene

Rural Airport Weather Station

AWOS, ASOS, and Advisory Weather Stations

By Aviation, Blog No Comments

Often a representative of an airstrip will call us asking for an AWOS. This often leads to a discussion of their expectations, needs, and budget.

AWOS vs ASOS

Generic terms often become associated with specific applications, AWOS is one such term. (It is typically pronounced as ay-woss, as in “Hey, toss me that wrench.” Or, “Hey, boss, how about giving me the day off?”)

The full AWOS name (automated weather observation system) sounds generic, but typically implies a class of weather station designated for aviation weather. To confuse things, ASOS (automated surface observing system) is also thrown around in a similar aviation context.

The functional differences are often of minimal importance to the aviation community, but AWOS is typically an FAA-certified weather station under the control of state, local, or private entities. The system is specifically installed and intended for aviation activities.

ASOS equipment is a cooperative effort involving the National Weather Service, FAA, and Department of Defense in the US. Like AWOS, the systems are designed specifically to serve the needs of aviation operations.

Both AWOS and ASOS systems imply a particular set of instruments. AWOS systems can be classified from AWOS I (one) to AWOS IV (four) Z/R. Each system incrementally adds more instruments. AWOS I starts with wind, pressure, temperature, and humidity instruments. Visibility, cloud ceiling, precipitation type, lightning, freezing rain, and runway condition sensors are added with each variant.

Not only is the initial cost of AWOS systems quite high, they must also be maintained by specially trained technicians in order to retain the certification. Due to their complexity and liability, maintenance requires special training anyway. Nevertheless, the total cost is often prohibitive to small airports, fly-in communities, and private operators, even when offset with government grant money.

Small Airports

So, what are small aviation users to do?

Most pilots are familiar with a plethora of aviation tools that run on Apple iPads (which seems to be the brand of choice). These planning and mapping tools often include weather data from AWOS or ASOS sources. Consequently, pilots have an expectation of the range of instrument data these certified systems provide.

However, these iPad tools are often issued under the “Advisory” umbrella, as well as many other instruments that private pilots add to their panel.

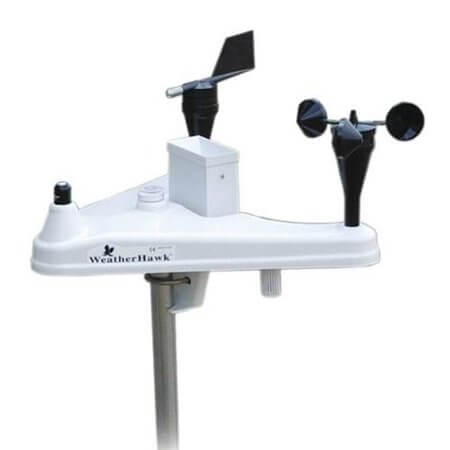
The advisory classification allows community airports, fly-in communities, and clubs to employ weather stations for their users. These could be $50 department store instruments or more expensive equipment like Dyacon MS-130.

The challenge is getting the information that you need, when you need it, and within the budget available.

Features

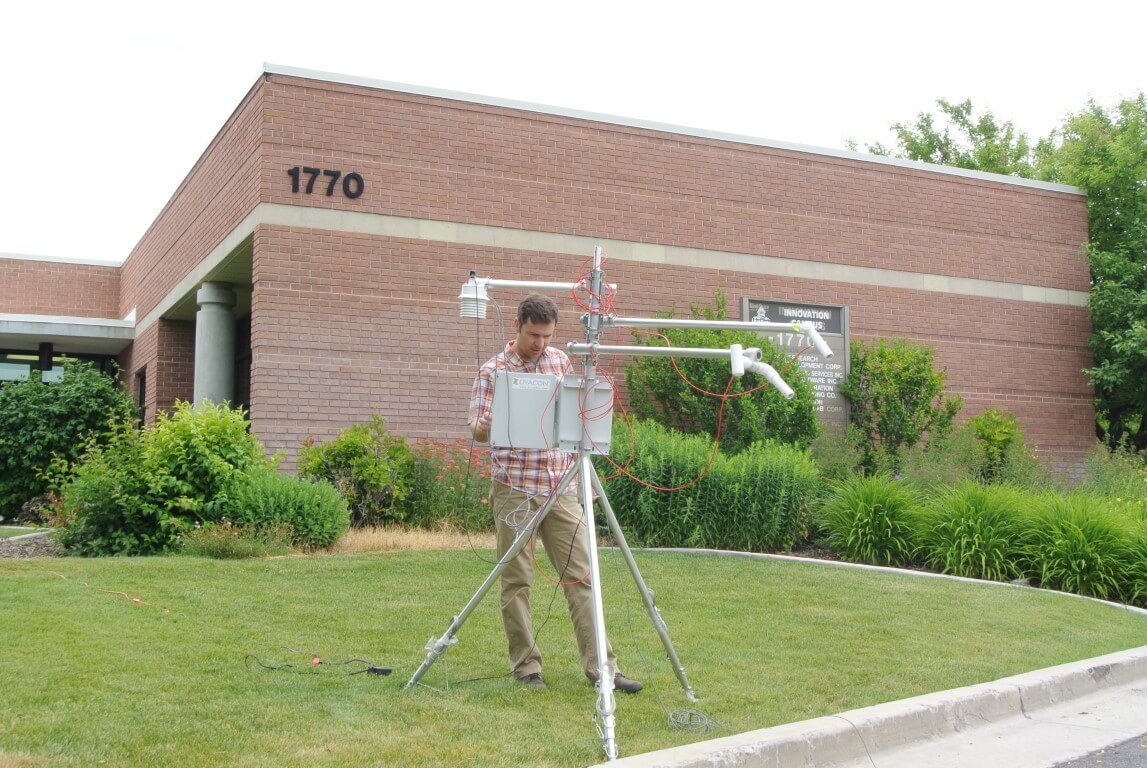
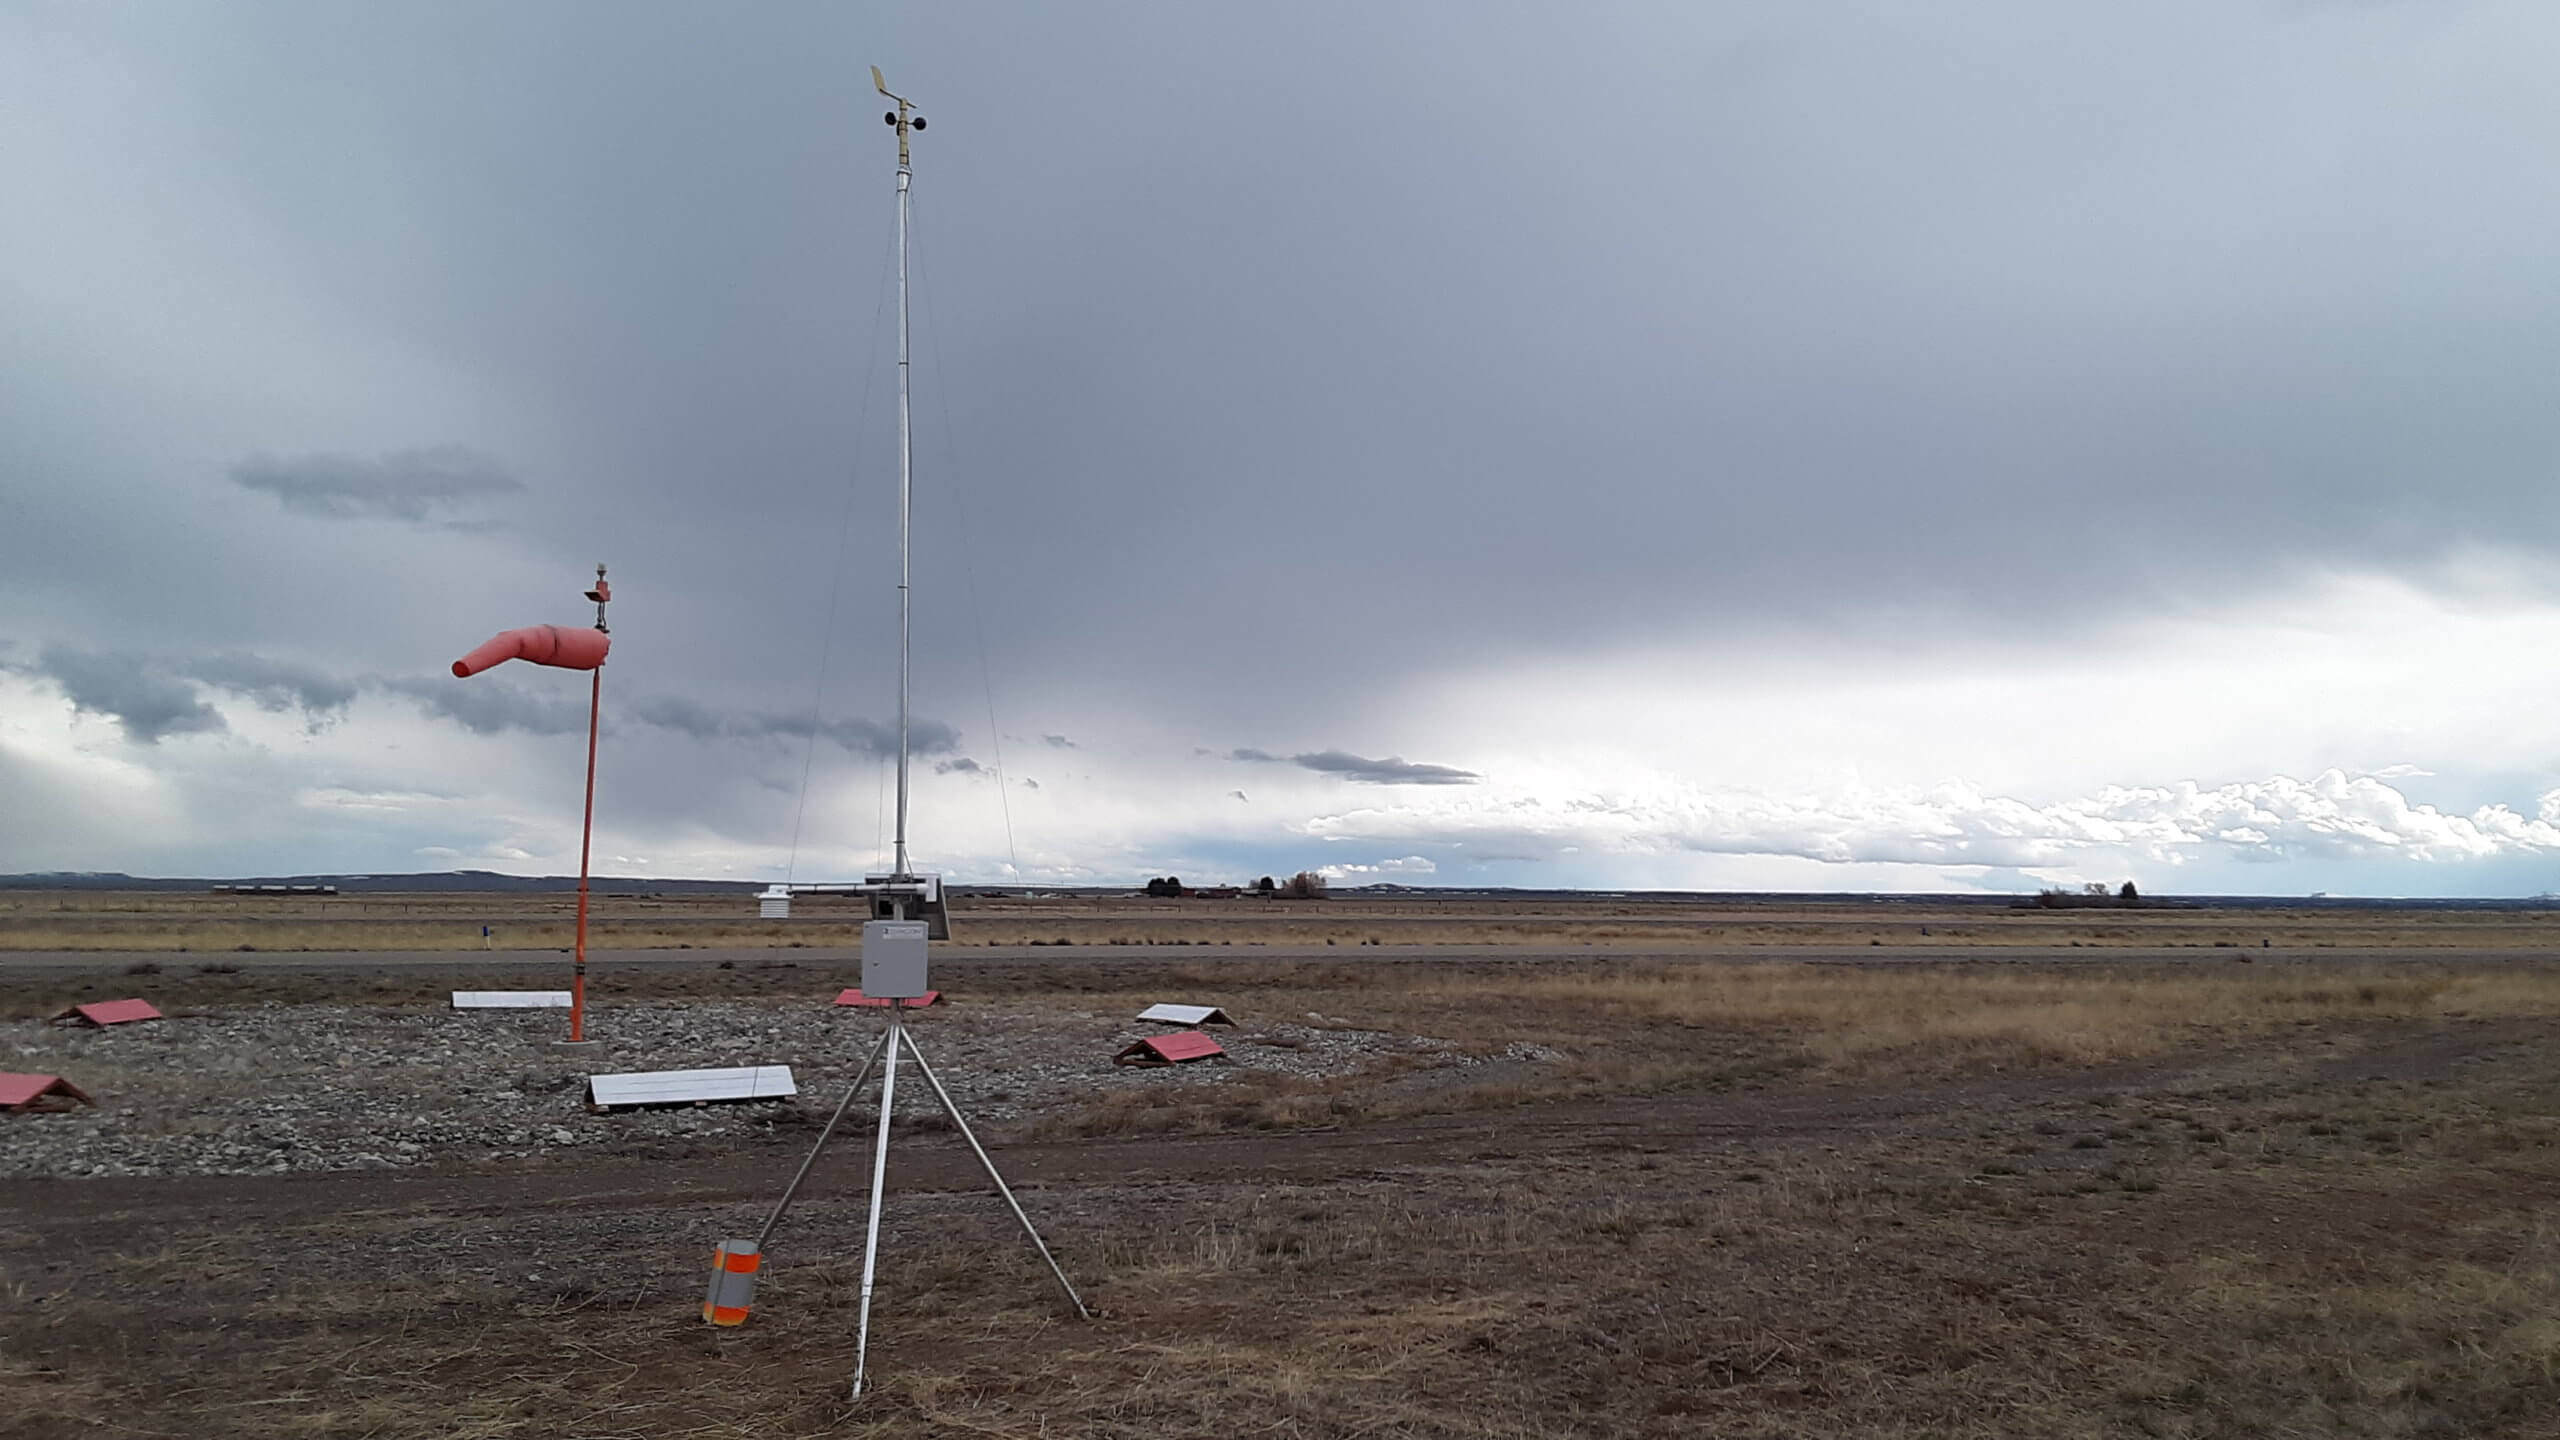
Dyacon’s weather stations provide a range of capabilities that have the potential to improve aviation safety. First, Dyacon weather stations can be installed, configured, and maintained by local pilots or technicians, no special skills are required. This reduces the total cost of ownership.

Unlike the disposable consumer-grade weather stations, Dyacon stations are modular and repairable.

Aviation weather station SMS text message.

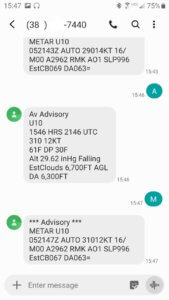
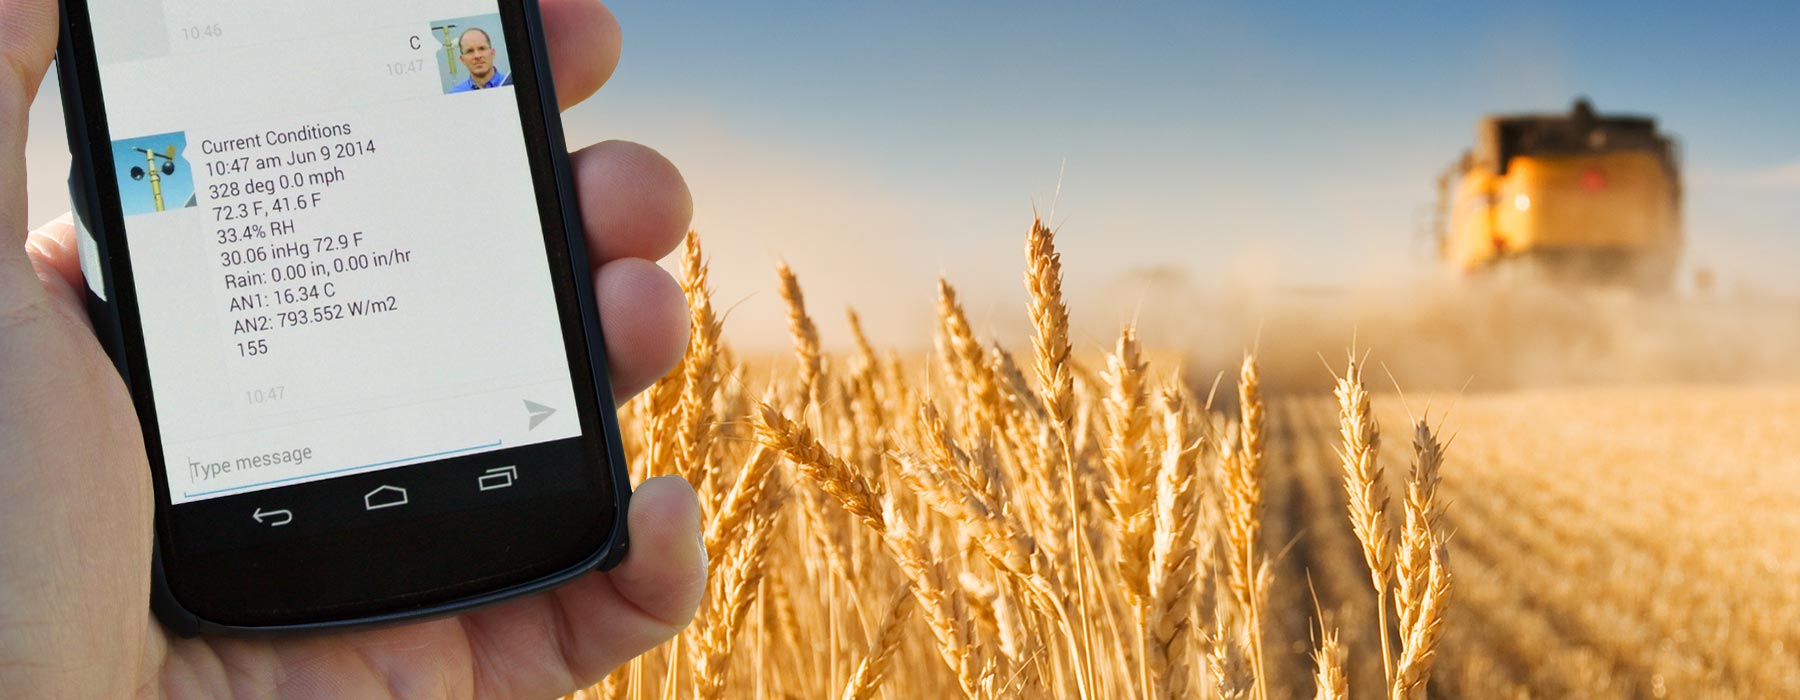
METAR and Plain Language Text Messages

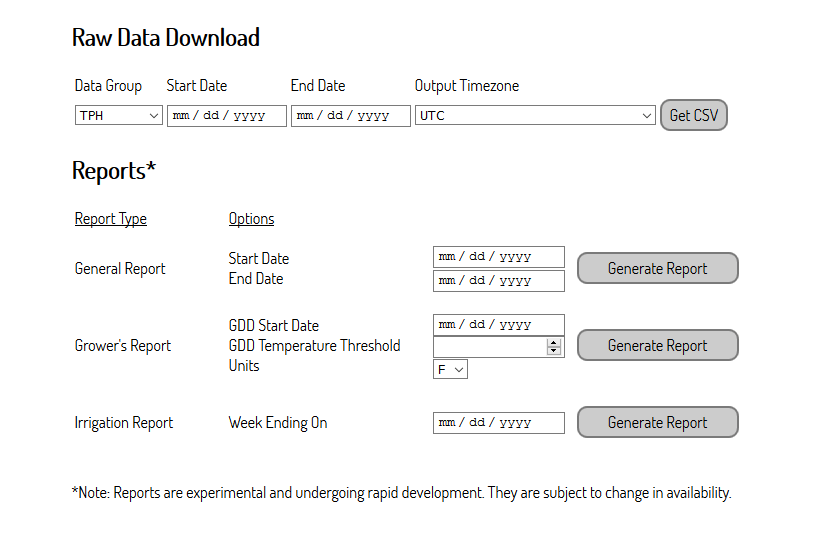
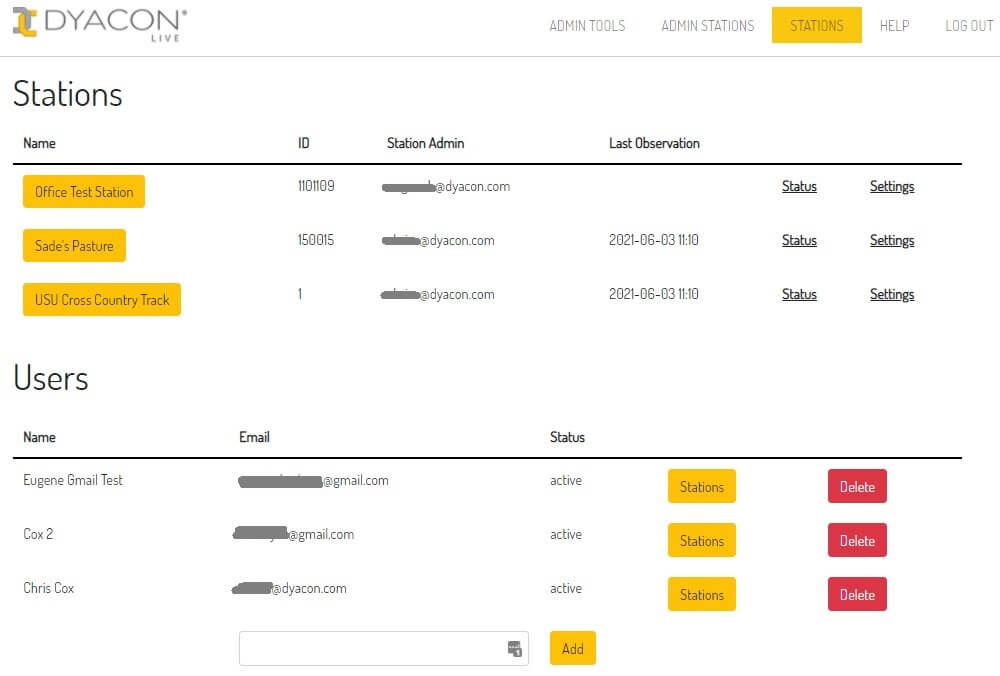
Weather data can be accessed in several ways:

  • SMS text message (METAR and plain-language formats)

  • Web portal (over cell phone)

    Aviation Console for Preston, ID (U10) Weather Station

    Aviation Weather Console for Preston, ID (U10)

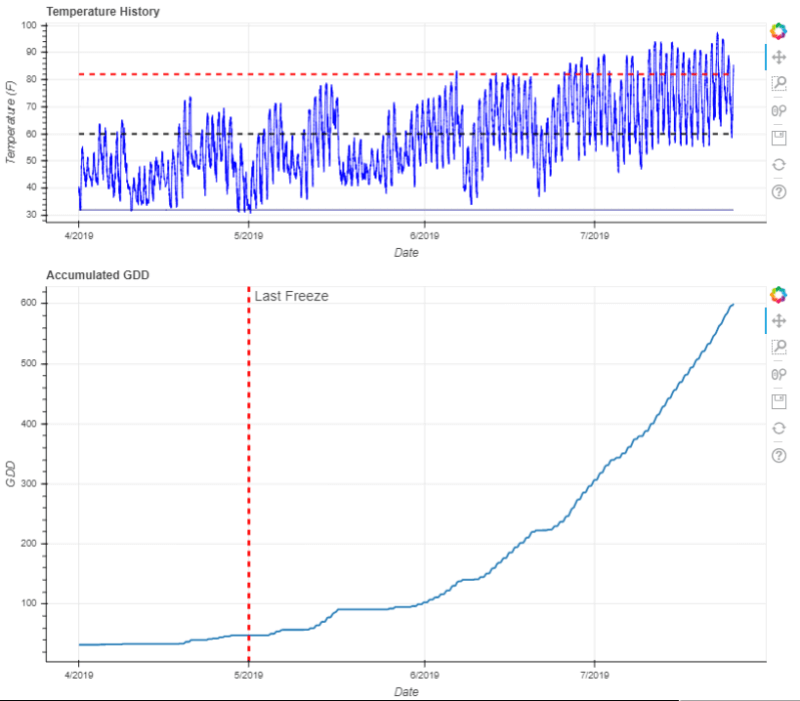
Both the DyaconLive web portal and SMS text messages provide density altitude, altimeter, and estimated cloud base.

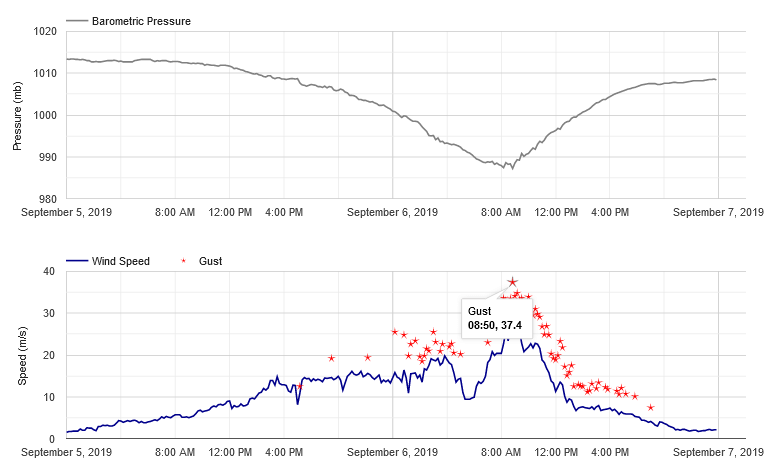
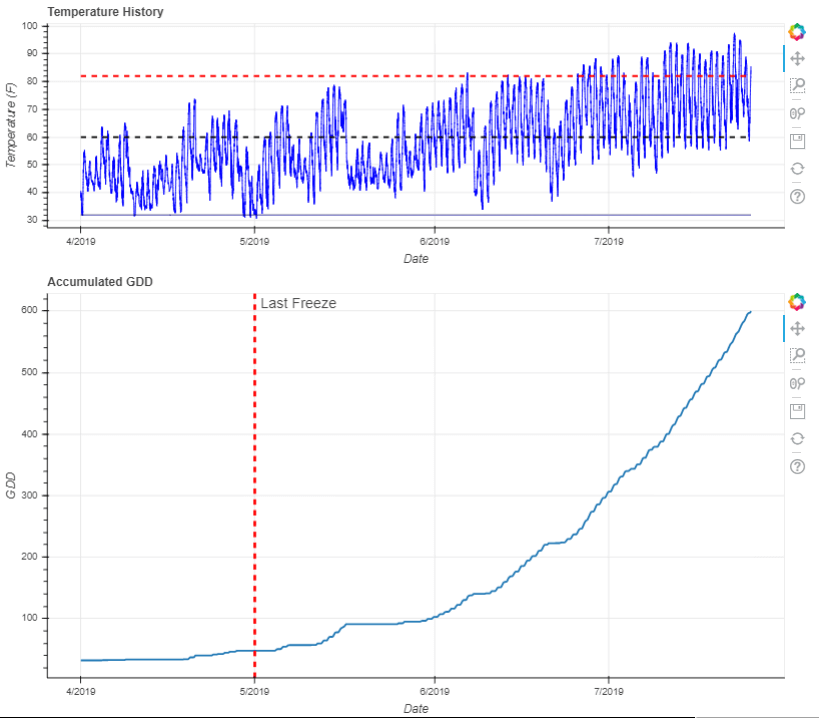
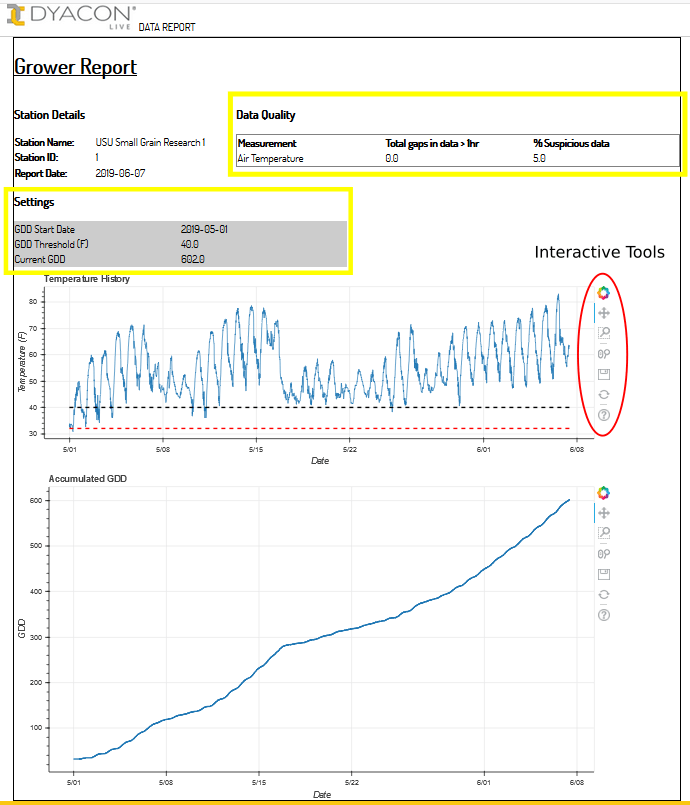
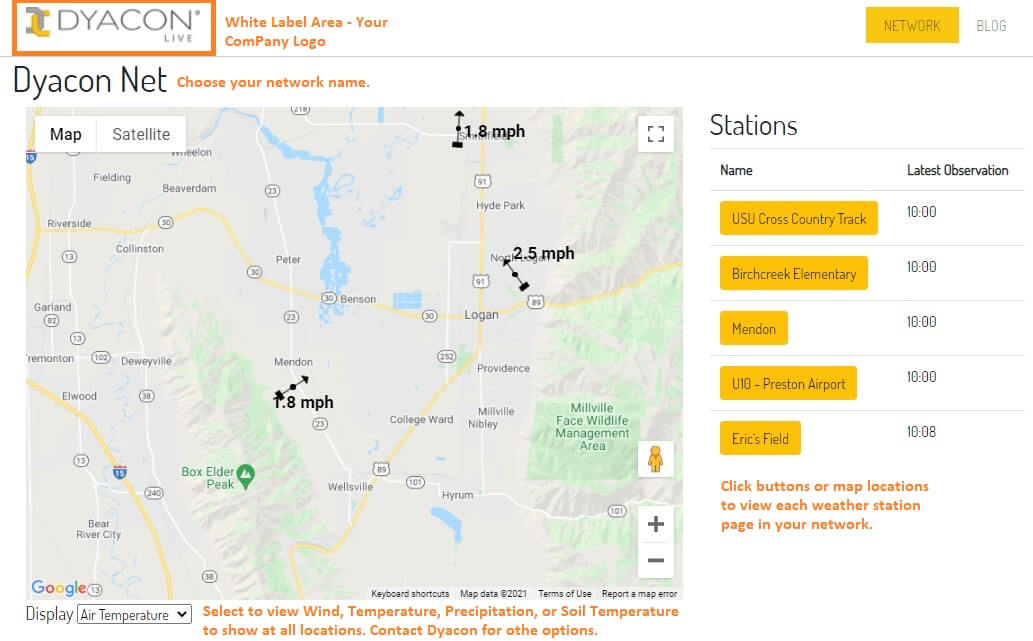
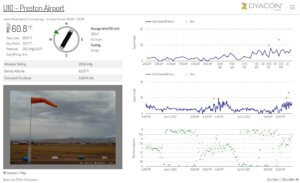
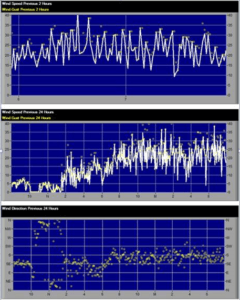
DyaconLive includes both current and historic information as well as NWS forecast information. The charted data helps pilots evaluate on-site weather trends. The web pages are accessible as a simplified public view or can be kept private for specific users.

The DyaconLive aviation console consolidates the critical aviation weather parameters on a single page, which is useful in flight planning rooms for pilots or in waiting areas for guests.

I could going into more features of DyaconLive for system monitoring and maintenance.

If you’d like to know more, give us a call.

Eugene

Big-Weather Company Tries to Make Small Station

By Blog No Comments

Afternoon (UTC) Presentation 

I came into the office one morning at 0730 hrs (1430 UTC) to sit through a presentation by a big-business weather equipment company. They invited me to a sales pitch for a new product that has not yet been released. (I always find it frustrating when a company tries to sell something that isn’t available.)

Nevertheless, the presentation was interesting and their marketing department created a highly-produced video that employed all of the popular buzz words like “micro-climate,” “future-proof,” “cyberattack,” “cloud computing,” and “IoT.”

Big-Weather’s Small Features

This new cost-optimized, professional weather station from Big-Weather is targeted to commercial users that only need one or two weather stations, want something easy to use, and don’t want to spend $10,000 USD. The basic weather data is automatically sent to their cloud service over a cell phone connection. The end solution is as plug-n-play as you can get in something that doesn’t come from a big-box store.

The system includes an integrated weather sensor suite that provides basic measurements of wind, temp, hum, precip, and pressure. This is accompanied by a solar panel, electronic control box, and separate cell phone box. The system does not have any configurable settings, no sensor options, no measurement interval option, no data cable connection, and no wireless communication options.

One interesting design choice was the system has only one day of autonomous power from the internal lead-acid battery. And, like the other features, there is no battery expansion option. But, should you need to run the weather station longer than one day without solar input, you can supply it with external power from an AC mains source.

How Much?

By the end of such a fancy presentation you might be asking: “What’s the price for this easy-to-use, no options system?”

And: “Do all of the sales reps have European accents?”

To get answers to those questions, you have to call your Big-Weather representative (because the price is a secret). You will also be informed that the system is not available until March 2021.

A Better Alternative from Dyacon

I apologize if I am being a little pithy and sarcastic, but us little guys have to make the best of what we are given and Big-Weather’s new product is an interesting benchmark. I am guessing that this new product was in development before the demise of Campbell Scientific’s WeatherHawk product line. Maybe now there’s a market gap.

Whether from Campbell Scientific or a European company, these easy-to-use systems made by big weather companies often bear the cost burden of their legacy products. These simplified products are also intentionally limited in features so as not to compete with the high-end systems from the same organizations. Fortunately, this leaves ample opportunity for Dyacon … and our customers.

So, if you want

  • Basic weather station and the ability to add other sensors,

  • Real-time wind gust capture,

  • Calculated values, such as dew point, 2 and 10 min wind averages, heat index, and so forth,

  • Autonomous operation of one week and the option to expand the battery and solar capacity,

  • DyaconLive web portal with user access control, optional public visibility, report generation, alerts, and maintenance management features,

  • Configurable local logging intervals from 1 to 60 min and DyaconLive upload intervals of 1 to 60 min,

  • Cell phone that allows users to install their own SIM,

  • Wi-Fi alternative to cell phone,

  • Modbus RTU port for cable connections to an external computer, PLC, BAS, SCADA, or other automation equipment,

  • Windows PC software for local weather display,

  • Aviation-specific features such as density altitude, estimated cloud base, two aviation web portal options, and redundant cable connection,

  • Sales and support direct from the manufacturer,

  • .. and more,

      you should probably chose a Dyacon weather station.

Dyacon Invitation

We like to be open with our customers, providing the information that professional users need to make an decision efficiently. To this end, our prices, manuals, videos, and configuration software are all on our website. You can also give us a call to discuss your needs. There is no screening, not tiered support plans, no exclusive dealer territories, and no European accent.

Dyacon may not be the oldest or biggest weather instrument company and we rarely wear white lab coats, but we do make one of the best professional weather stations for commercial, industrial, agricultural, and aviation users. And, yes, we also sell equipment to “research” users.

If you need a network of weather stations or just one, please check out our products. I think you will find Dyacon to be a compelling alternative that is available now.

Eugene

Weather Hawk Station

WeatherHawk Alternative

By Blog No Comments

A Little History

Many readers will be familiar with the work and anxiety that goes into starting and operating a small business, especially a bootstrap operation funded through the skills, blood, sweat, and tears of the founders. When I hear of a business failure, I have some idea of the turmoil, heartache, and disappointment of the owners. I’ve been there. It is emotionally wrenching to walk away from a business. (Don’t worry. Thanks to some hard lessons from previous ventures, Dyacon is on a good course.)

While well-funded businesses may not leave the same wake of personal wreckage of a small business, there is still a toll to the employees when they are “restructured.”

Campbell Scientific, “world renowned” for their environmental data loggers, is located just down the street from Dyacon. In an effort to attack a broader market, Campbell Scientific (CSI) created a division called WeatherHawk. Their 900 series weather stations enjoyed good representation as a component of high-end home automation systems and similar applications. And then, Control4 realized that they could pull weather adequate data from “the internet” for free (<sarcasm>Because everyone knows that the internet is where good local weather data is found. Just ask Google.</sarcasm>).

In addition to integrated weather platforms, WeatherHawk also contracted with offshore manufacturers to create a line of handheld weather instruments, which is a very competitive market.

In spite of the challenges, CSI is a patient company and does not pull the plug on ventures until they’ve done everything they can to see them through. While I don’t know all of the reasons for the business decision, WeatherHawk has been effectively closed. Quoting from their website: “WeatherHawk has been absorbed into the regular operations of Campbell Scientific Inc.” And, as of 31 May 2020, “All other operations [have ceased].”

I was sorry to hear the news.

Early on when we were just developing our weather instruments, a salesman from Met One said the weather business was very incestuous. Indeed, there is a lot of overlap in the weather station business with one company selling a competitors products in order to meet the unique needs the end user.

While WeatherHawk 900 weather stations had slight overlap with Dyacon, our business strategies were significantly different. Dyacon has been very focused on developing our own instruments and web portal for aviation, commercial, and industrial users. Whereas, WeatherHawk was mostly focused on prosumers.

Note: If any of my friends at CSI wish to correct the above, please drop me a note.

Where Should WeatherHawk Users Go?

While exhibiting at the Great Alaska Aviation Gathering in 2019, we encountered an aviation company that was using a WeatherHawk 900 system for critical flight operations. They had contracted with another company to develop some customized charts to augment the WeatherHawk, but the system was aging and a new one was needed.

WeatherHawk Charts

Of course, I wouldn’t be writing this article if they had selected Davis Instruments or some other system.

Dyacon now provides this flight services company with an internet-connected weather station accessible through DyaconLive. The end solution is far simpler than the multi-tiered system that was previously required to connect the WeatherHawk to Ethernet, send the data to a server, convert the data to a jpg image, and display it on a computer. In spite of the hurdles, these charts were critical to providing an intuitive indication of the flight conditions for the pilots operating in a dangerous, turbulent location.

Based on user feedback, DyaconLive Aviation Console provides pilots with real-time, advisory surface weather data. The DyaconLive web portal allows pilots, flight managers, and staff to check conditions remotely, whether in Anchorage or Nanwalek. While an AWOS may be ideal, they are far too expensive and complex to serve the needs of most air ports and back-country landing strips.

If you are looking for an alternative, upgrade, or replacement for a WeatherHawk station, please keep Dyacon in mind. We design and manufacture most of our own equipment and web portal; giving us the capability to offer a level of service that most companies can’t, including a ground-up design for your network needs (which is a story for another time).

Eugene

Maintenance Management System

By Blog No Comments

Maintenance Management System
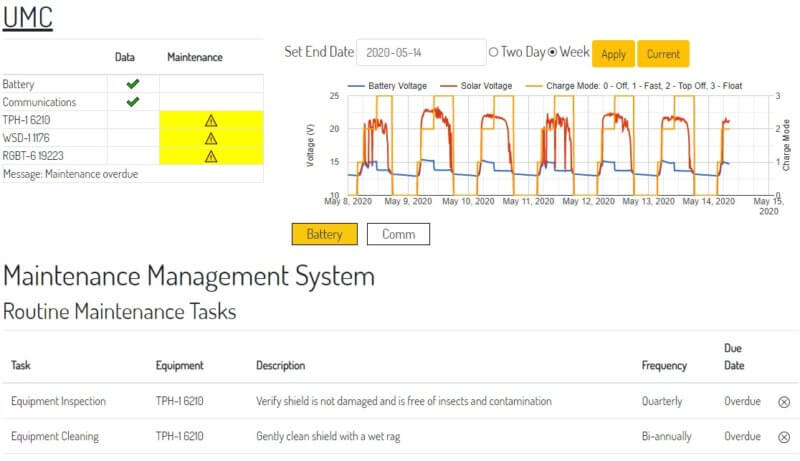
Just like any other piece of equipment exposed to the elements, weather stations need occasional service. For a hobbyist, weather station maintenance is not a problem: one station, one user. However, for professional users, maintenance tasks compete for time and resources. Staff changes can also cause a loss of continuity of knowledge.

The Book

Weather Station Service Log Notebook

A weather station site maintenance log is often used by weather station technicians. A notebook may be used to manually record equipment deployed, site visits, sensor service, and configuration changes. This information helps with data quality control. Disruptions or step-changes to senor readings can be correlated to service activities.

(Of course, the notebook is only as usable if others can decipher the handwriting.)

Maintenance Management System

As of 13 May 2020, DyaconLive now includes a maintenance log system. We have retroactively recorded the weather station equipment at current customer sites. Those customers with multiple sites, may need to adjust their equipment records.

The maintenance management system allows technicians to enter their own service schedule for the various sensors. Notifications are visible at the top of the Status page. Activities can be recorded on a data entry form. Site equipment is tracked in a table at the bottom.

Of course, any record is only as good as what you feed it. Information can be entered from your computer or handheld device. We have tried to make MMS as usable as possible and will continue to build on this feature.

In the end, a little routine attention will ensure a reliable meteorological station and a long service life.

Eugene

Hurricane Test #1 – The Dorian Job

By Blog, Uncategorized No Comments

Wind tunnel testing has its place, but the real-world can be a bit rougher, like hurricane Dorian rougher. Well, maybe that sound a little hyperbolic, but 84 mph wind is still quite a bit.

Our customer reported: “The two Dyacon met stations we currently have running made it unscathed through Hurricane Dorian that just hit us. Max recorded gust from the Dyacon stations was 37.4 m/s (84 mph). . . . Not sure if this is the first CAT 1 hurricane the sensors have been through, but thought you may be interested to know.”

Dyacon sensors have been tested beyond 84 mph on a mobile platform, but this was the first time we have seen this speed in the wild as part of a full weather station.

The map shows the location of the weather station in North Carolina.

USACE Station Map

The charts below are from DyaconLive. The peak gust measured was 37.4 m/s (83.7 mph). The maximum 10 min average at the same point was 26.9 m/s (60.2 mph).

USACE Huricane Dorian Wind Chart

The user has enabled the public page. So, you’re welcome to take a look at the weather station page.

USACE #2

The weather station configuration deployed at this site is Dyacon MS-130.

Eugene

GDD Chart w-Freeze

DyaconLive v1.19

By Blog No Comments

DyaconLive is an ongoing project. We want your weather station to provide usable, actionable information. The Grower’s Report is a case in point.

v1.19 Summary

DyaconLive release version 1.19 on 15 July 2019 included the following improvements.

  • Grower’s Report now includes an upper temperature threshold and last freeze marker.
  • Charts added for new IRT-201 infrared temperature sensor.
  • Sunrise/sunset added to Weather page.
  • Improved screen size responsiveness for mobile devices.
  • And, some back-end work, which is always going on.

By the way, Chris Cox, our staff scientist and DyaconLive developer deserves a big pat on the back for his work.

Improved Responsiveness

The navigation menu at the top of the screen should collapse into an icon on smaller screens.

Personally, I’m not a fan of the three-line, hamburger icon, it’s a bit ambiguous. But, when your computer has to fit in the palm of your hand, there isn’t much choice.

This may work better on some devices than others. Let us know what you find.

Grower Report Improvements

When setting the Grower’s Report, the upper threshold is added in a new field. For some crops, such as corn, hotter does necessarily mean more growth. The upper threshold is capped at this value. (Upper threshold is not required to generate GDD.)

Grower Report Settings

This upper threshold is shown on the temperature history chart.

The Last Freeze value is shown on the GDD chart.

GDD Chart w-Freeze

If you have other reports you would like to see, please let us know.


Eugene

Light Theme, Weather Station Display

In The Dark

By Blog No Comments

I’ve worked in cubicle environments where windows were scarce. In fact, in one job as a product design engineer, my desk was in the server closet; no windows, constant fan noise, and plenty of heat. Fortunately, I could get up a few times a day and walk outside. However, the owner’s desk was by the only entrance. So, to go outside for some light, you were advertising that you were not at your desk. And, if that wasn’t enough, he had cameras covering the whole work area so he could keep an eye on you even at your desk.

Of course, it could be worse, some people work in underground buildings; no windows and no outdoor strolls to keep one in touch with reality.

A Dyacon weather station was sold to just such a place. Not only is it underground, but there is no internet connection and no wireless was allowed. Dyacon Weather Station display software was included with the weather station purchase.

Weather Station Display is displayed on a computer monitor in break room areas, along with closed circuit camera images. The intent is to provide employees with some contact with the surface conditions.

Weather Station Display software not only meets the needs for a simple weather station interface, but also connects directly to the weather station. For security and practical reasons, wireless was not an option.

So, if you are in the dark regarding weather, Dyacon has an answer.

Eugene

Infrared Temperature Sensor

By Blog No Comments

*NOTE: This blog post is out of date. Some information may no longer be relevant.*

We are always working on one development or another, whether DyaconLive, new sensors, new [secret stuff], or expanding the capabilities of existing weather station capabilities.

Recently, we were contacted by an organization that needed a reasonable cost solution for a heat-island study. The goal was to collect baseline pavement surface temperature this year, apply new surface treatment, and then measure the difference next summer. The system had to provide real-time data to a web portal as well as local data logging.

So, we went to work; leveraging our CM-1 weather station controller and DyaconLive in order to deliver the functionality required in the short time frame.

First Test Of Infrared Thermometer

It’s always fun cobbling together the first system and giving it a spin. Often we are enamored by its inelegance. As the images attest, this is definitely not elegant. But, that comes with time. At this stage, the data is most important; and, Chris, our staff scientist, is whiz at collecting data and building scripts for analysis.

Infrared Thermometer Applications

In addition to the heat-island study at hand, there are a number of applications that we can see for this new device.

Sub-surface temperature modeling

Foliage and crop canopy temperature

Ground temperature

Road surface temperature

Race track temperature

Roof temperature

Storage tank surface temperature

Outdoor sport court temperature

I’ll leave you to come up with more applications for an infrared temperature sensor for your business. Give us a call if you want to explore anything in particular.

The measurement temperature range of this device is -20 °C to 1000°C (-4° to 1830°F), which is quite a spread. While the maximum temperature is inadequate for plasma furnaces, it is high enough to monitor your local lava flow.

Please check back later. I’ll add more to this post as we make progress toward product release in August.

Eugene

Weather station data to cell phone

DyaconLive Growers Report

By Blog One Comment

DyaconLive provides our customers with an easy to use website for staying up to date with current weather conditions and makes it easy to download historical station data. However, we know that for many applications weather data is just the first component of more in depth analysis. Indeed, the key value provided by a station may not necessarily be the raw measurements, but rather the derived quantities that can provide actionable information. The question a business owner faces might not be “What is the temperature?” but rather “What is the trend in average temperature?”.

At Dyacon, we strive to facilitate this need for actionable insights. As part of this effort, we are introducing DyaconLive Reports. These are application-specific reports that are downloaded from DyaconLive and provide sophisticated data analysis in a user friendly interface.

One of the reports now available on DyaconLive is a “Grower’s Report”. This report is specifically targeted at agricultural producers and helps monitor crop growth by calculating Growing Degree Days (GDD) (https://en.wikipedia.org/wiki/Growing_degree-day). GDDs are calculated from air temperature measurements above (or sometimes below) a certain threshold.

Mathematically:

This equation is often simplified by using daily max/min values. Temperature is an important factor in plant and insect growth, so GDDs provide a means of evaluating when a particular crop or insect will reach maturity. This helps grower’s anticipate problems and plan for harvest.

The figure below shows a typical Grower’s Report for one of Dyacon’s test stations in Logan, Utah. The key components of the report, common in many different reports, are highlighted yellow. Near the top is an overview of station metadata and the dates associated with the output. A data quality assessment table is displayed next to the station table, and this is arguably one of the most important components of any report. Without good quality input data, the report output is meaningless. Input data quality is assessed automatically by the DyaconLive server when the report is generated. Measurements are assessed for reasonableness in terms of data values, behavior, and in some cases consistency with other measurements. The details behind these algorithms will be discussed further in a future blog.


The main output of the report consists of a summary table detailing settings and totals, and interactive charts for visualizing report output. The Grower’s Report charts temperature over the report timeframe and shows where the GDD threshold is located relative the temperature measurements. The GDD chart shows accumulated GDD and how it is changing through time. Users can assess current GDD values to determine how their crop is maturing.

Weather Station Requirements

  • Temperature
  • DyaconLive connection

Compatible Dyacon Weather Stations: MS-120, MS-130, MS-135, MS-140, MS-150

The only measurement required for this report is air temperature, which should be present on all Dyacon meteorological stations. It is worth noting that other reports will require a wider variety of instruments not present on every station.

How To Generate Your Report

Report generation currently requires Manager or Admin level access to DyaconLive.

  • Log in and navigate to the “Reports” section of the Data Page for your station.
  • Select a start date, temperature threshold, and temperature units.
  • Select ‘Generate Report’ and the report will be displayed in the browser.

Chris Cox