Device Names
A data logger (or datalogger) is a device that retrieves data from sensors and stores it for later retrieval. While the word “datalogger,” and its variants (“logger,” “data recorder,” “programmable data logger”), are common in the environmental monitoring industry, other industries sometimes use slightly different terminology.
For laboratory settings, a “data acquisition system” (DAQ or DAS) is a common description. These are typically bench-top instruments and may be focused on high frequency, or specialized data measurements. The connectors, enclosure, and operating temperature are intended for indoor applications.
In the industrial sector, “data recorder” or “process recorder” might be used to monitor ongoing automation system activities. The data recorder in conjunction with the software has been given the verbose description of “operational historian”. Regardless of the differences in terminology, the basic idea is to measure and store data from sensors.
Common Data Logger Features
Data logger features can vary substantially, with different designs for specific applications and cost constraints. However, a general purpose data logger typically has some features that go beyond simply measuring and storing data. These features include:
- Structured data storage (example: CSV)
- Broad sensor electrical and protocol compatibility (analog, digital, pulse, frequency)
- Scheduled and programmable measurements
- Basic processing of raw data, such as average, min, max
Data Storage
Data storage can be as simple as the raw numbers in a text file, but generally there is structure such as an associated time stamp. These may be stored as columns in a CSV file. Storage of metadata (equipment used, units, and so forth) is also important to record.
Sensor Compatibility
It is difficult for manufacturers to design a device that is compatible with every possible sensor, but general purpose data loggers support a broad range of digital and analog sensor outputs.
Data loggers may be limited by the number of ports on a device, program inflexibility, and incompatibility with sensor output type. This means that data logger hardware must be evaluated in conjunction with the sensors required for a particular application.
Programmability
Sensor measurements typically occur on a schedule that ranges from milliseconds to hours, depending on the application. Programmable data loggers allow for adjusting measurement schedule. Often calculated values, such as minimum, maximum, and average can be stored.
Advanced Data Logger Features
More sophisticated general purpose data loggers have a number of advanced features:
- Concurrent sensor measurement timing
- Advanced programmability
- Data quality monitoring
- Sensor equipment controls
- Data transmission
- Field Serviceability
Measurement Timing
Timing of measurements is often crucial for data interpretation and advanced data logger software is structured to execute measurements concurrently rather than sequentially. For example, if two sensors are connected to the data logger and one of the sensors requires 10 seconds to perform a measurement while the other sensor only requires 1 second, the faster measurement should not wait for the slower measurement to finish. Concurrent execution enables both measurements to stay on schedule.
Timing can also be important for the operation of secondary sensor equipment like wipers on optical sensors and sensor heaters. Advanced data loggers can control secondary equipment and be programmed to activate it on a schedule or in response to events.
Advanced Programmability
Data loggers have a wide variety of user interfaces. Many programmable data loggers use a proprietary script language or configuration wizard. Proprietary software tools will facilitate configuration, data collection, and data visualization, but may limit program flexibility. Whereas a data logger built from a small micro-controller device like Arduino may have more flexibility, but will require high-level programming skills to configure and collect data.
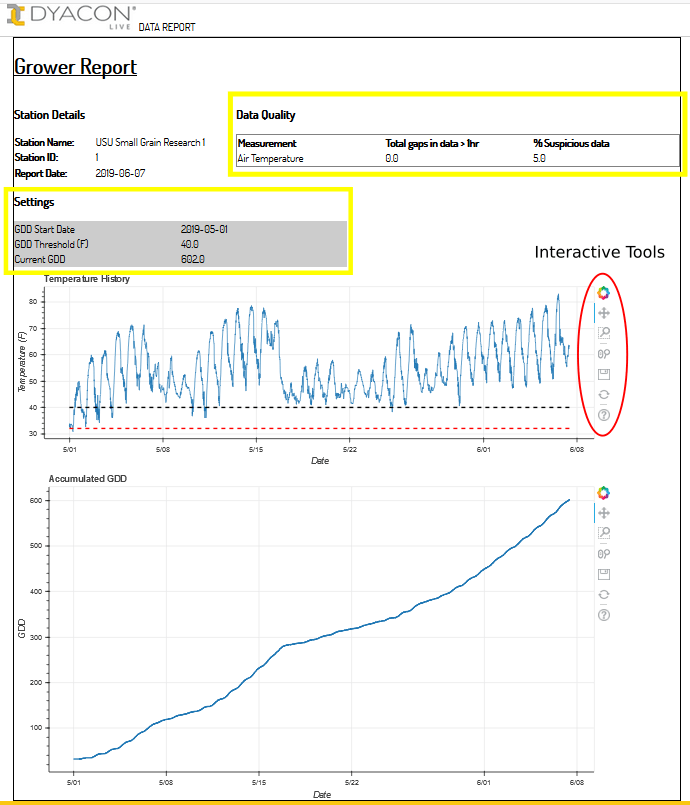
Data Quality Monitoring
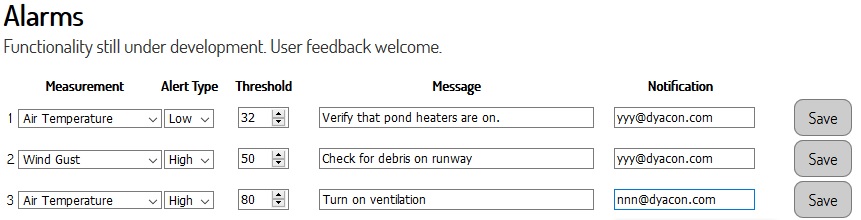
Advanced programmability allows users to perform data quality monitoring at the point of measurement. The data logger can then react to sensor readings by initiating a new measurement, resetting a device, or sending alerts to operators.
Control Output
Some data loggers also include control outputs, allowing them act on measurement conditions, such as turning off a pump when water level reaches a set point.
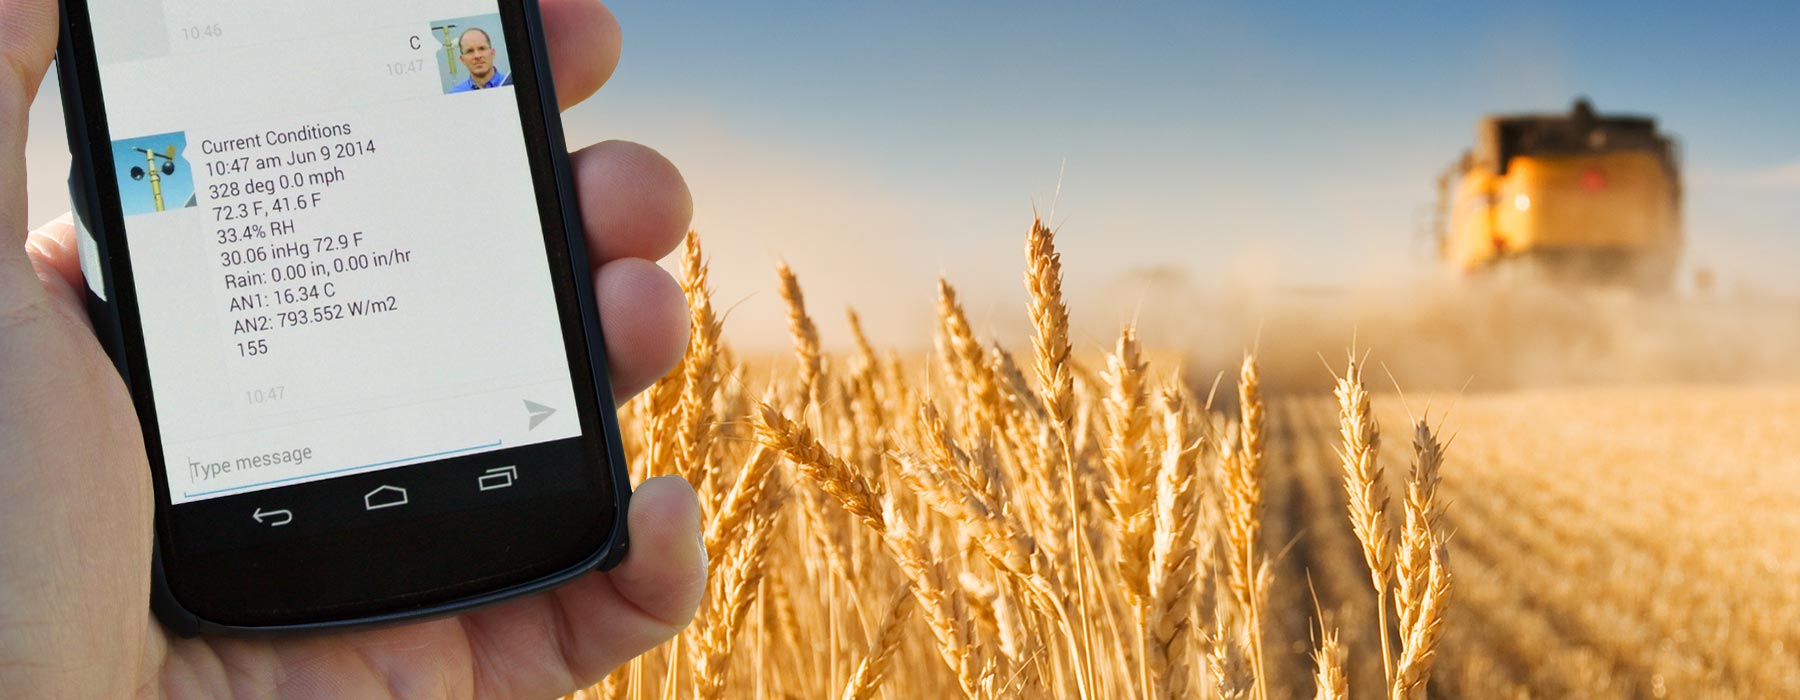
Data Transmission
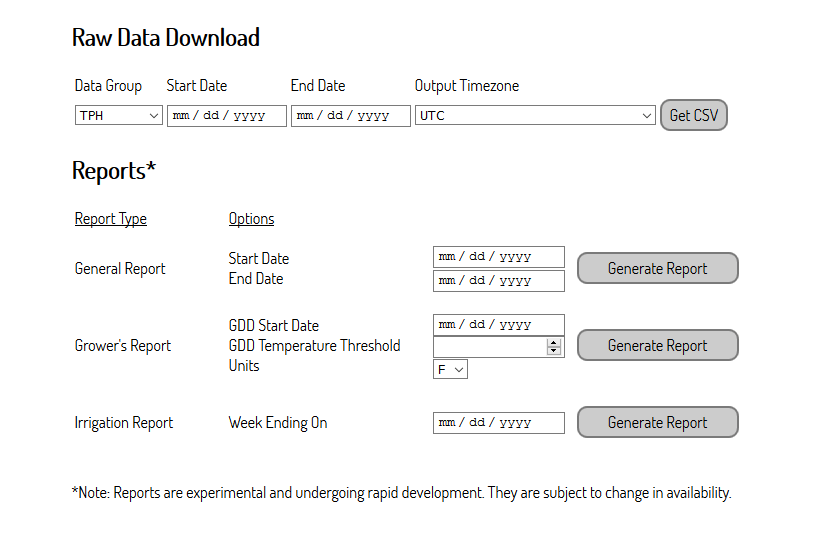
Historically, getting the data off of the data logger has required a manual task involving connecting the device to a computer and transferring files using proprietary software. Modern data loggers use automatic data transmission via the internet, cell phone, satellite, or radio. Data transmission enables live monitoring of the data collection and automatic data monitoring helps ensure the data is immediately useful. Real-time transmissions ensure that operational problems can be rapidly identified and addressed.
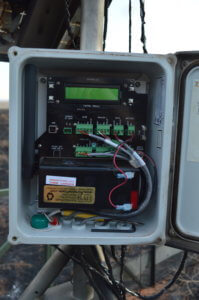
Field Serviceability
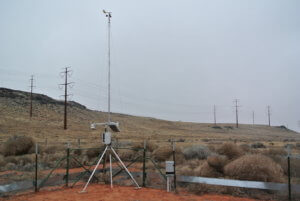
Field serviceability is critical for environmental data loggers. They are often deployed in remote locations. Any features that limit the equipment required for service or facilitate troubleshooting will result in time and cost savings to the user, as well as improve up-time.
An LCD or OLED display can allow for better on-site system monitoring and troubleshooting.
In addition, a user input method is a necessary companion to the display. Even paging through current measurements or error codes can be an invaluable aid to field service technicians.
Animal damage, weather damage, and normal wear and tear will damage cables. Field serviceable connectors can be important for unexpected repairs.
Overall, system design that minimizes tools, cables, software, and equipment required for field activities is an important design priority.
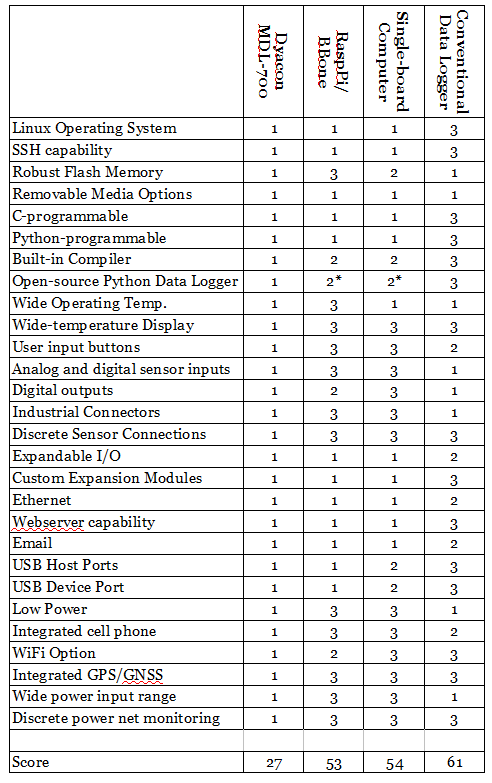
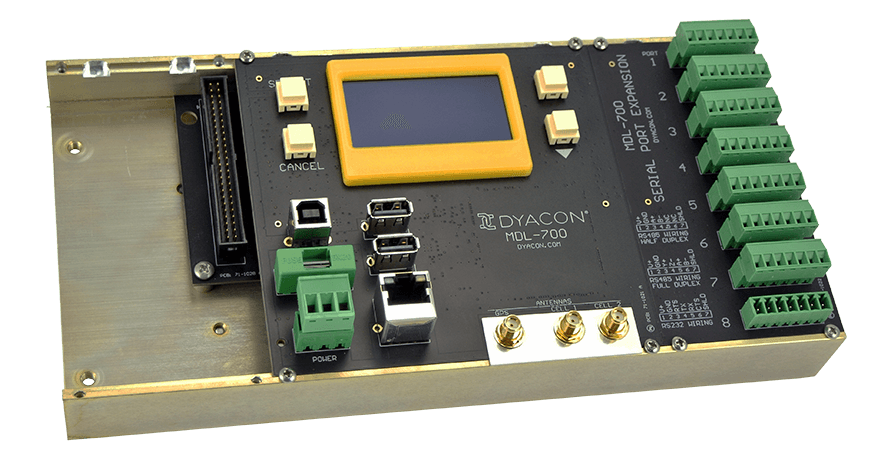
This spring, Dyacon is introducing the MDL-700, a fully featured data logger that is modular in design to accommodate a wide range of applications. One unique feature of the MDL is the Linux operating system. Rather than using proprietary software that offers a limited number of features, the MDL can be programmed however the user desires. It is compatible with languages like C and Python out of the box.
We also provide open-source Python based software (pyMDL – https://github.com/dyacon/pyMDL) with the goal of implementing as much of the functionality discussed above as possible. PyMDL is still in early development stages, but should be usable by almost anyone by the time the MDL begins shipping to customers in March.
Since the software is open source, people are welcome to contribute new features or to take the code and customize it to their unique needs.
Summary
No tool is right for every job. Data loggers come in unique flavors for each application.
Please contact Dyacon if you have any data logger questions. We are happy to help if we can or refer you to another source if we can’t.
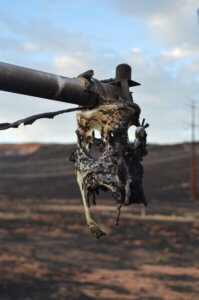
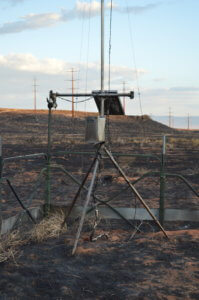
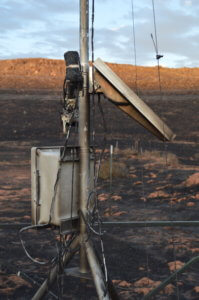
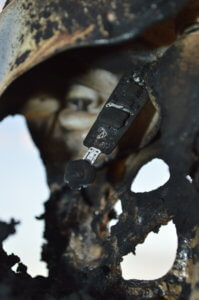
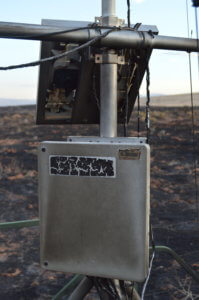
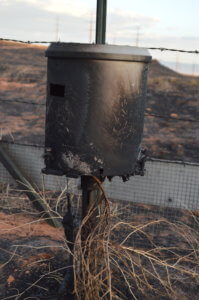
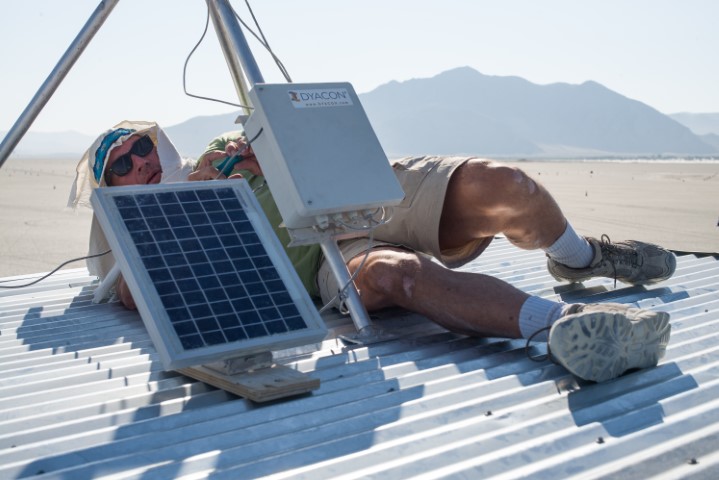
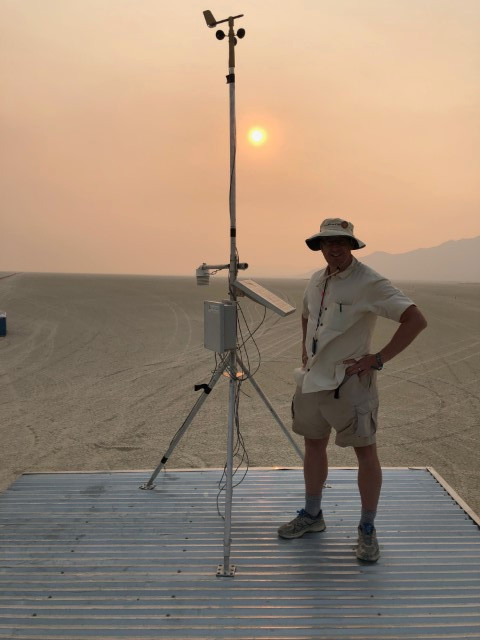
 Every weather station company has their own stories about equipment caught in wildfires, to which we add our own.