Dyacon MDL-700 with Serial Expansion Module

What is a Data Logger?

By Uncategorized No Comments

Device Names

A data logger (or datalogger) is a device that retrieves data from sensors and stores it for later retrieval. While the word “datalogger,” and its variants (“logger,” “data recorder,” “programmable data logger”), are common in the environmental monitoring industry, other industries sometimes use slightly different terminology.

For laboratory settings, a “data acquisition system” (DAQ or DAS) is a common description. These are typically bench-top instruments and may be focused on high frequency, or specialized data measurements. The connectors, enclosure, and operating temperature are intended for indoor applications.

In the industrial sector, “data recorder” or “process recorder” might be used to monitor ongoing automation system activities. The data recorder in conjunction with the software has been given the verbose description of “operational historian”. Regardless of the differences in terminology, the basic idea is to measure and store data from sensors.

Common Data Logger Features

Data logger features can vary substantially, with different designs for specific applications and cost constraints. However, a general purpose data logger typically has some features that go beyond simply measuring and storing data. These features include:

  • Structured data storage (example: CSV)
  • Broad sensor electrical and protocol compatibility (analog, digital, pulse, frequency)
  • Scheduled and programmable measurements
  • Basic processing of raw data, such as average, min, max

Data Storage

Data storage can be as simple as the raw numbers in a text file, but generally there is structure such as an associated time stamp. These may be stored as columns in a CSV file. Storage of metadata (equipment used, units, and so forth) is also important to record.

Sensor Compatibility

It is difficult for manufacturers to design a device that is compatible with every possible sensor, but general purpose data loggers support a broad range of digital and analog sensor outputs.

Data loggers may be limited by the number of ports on a device, program inflexibility, and incompatibility with sensor output type. This means that data logger hardware must be evaluated in conjunction with the sensors required for a particular application.

Programmability

Sensor measurements typically occur on a schedule that ranges from milliseconds to hours, depending on the application. Programmable data loggers allow for adjusting measurement schedule. Often calculated values, such as minimum, maximum, and average can be stored.

Advanced Data Logger Features

More sophisticated general purpose data loggers have a number of advanced features:

  • Concurrent sensor measurement timing
  • Advanced programmability
  • Data quality monitoring
  • Sensor equipment controls
  • Data transmission
  • Field Serviceability

Measurement Timing

Timing of measurements is often crucial for data interpretation and advanced data logger software is structured to execute measurements concurrently rather than sequentially. For example, if two sensors are connected to the data logger and one of the sensors requires 10 seconds to perform a measurement while the other sensor only requires 1 second, the faster measurement should not wait for the slower measurement to finish. Concurrent execution enables both measurements to stay on schedule.

Timing can also be important for the operation of secondary sensor equipment like wipers on optical sensors and sensor heaters. Advanced data loggers can control secondary equipment and be programmed to activate it on a schedule or in response to events.

Advanced Programmability

Data loggers have a wide variety of user interfaces. Many programmable data loggers use a proprietary script language or configuration wizard. Proprietary software tools will facilitate configuration, data collection, and data visualization, but may limit program flexibility. Whereas a data logger built from a small micro-controller device like Arduino may have more flexibility, but will require high-level programming skills to configure and collect data.

Data Quality Monitoring

Advanced programmability allows users to perform data quality monitoring at the point of measurement. The data logger can then react to sensor readings by initiating a new measurement, resetting a device, or sending alerts to operators.

Control Output

Some data loggers also include control outputs, allowing them act on measurement conditions, such as turning off a pump when water level reaches a set point.

Data Transmission

Historically, getting the data off of the data logger has required a manual task involving connecting the device to a computer and transferring files using proprietary software. Modern data loggers use automatic data transmission via the internet, cell phone, satellite, or radio. Data transmission enables live monitoring of the data collection and automatic data monitoring helps ensure the data is immediately useful. Real-time transmissions ensure that operational problems can be rapidly identified and addressed.

Field Serviceability

Field serviceability is critical for environmental data loggers. They are often deployed in remote locations. Any features that limit the equipment required for service or facilitate troubleshooting will result in time and cost savings to the user, as well as improve up-time.

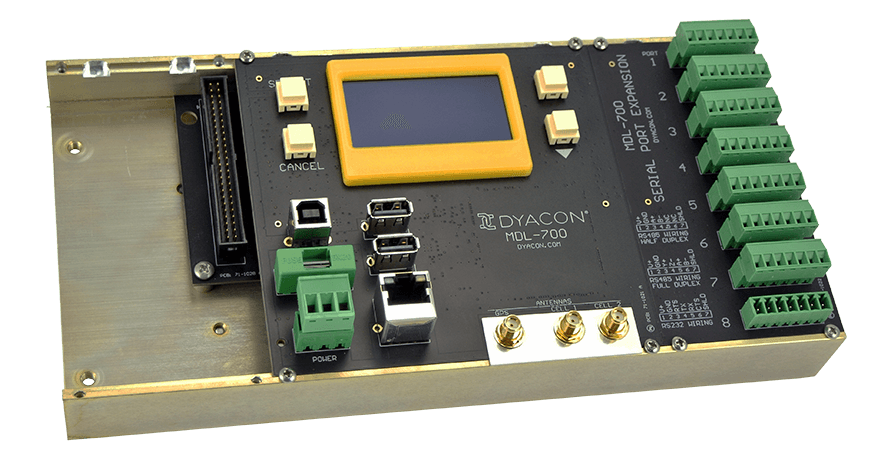
An LCD or OLED display can allow for better on-site system monitoring and troubleshooting.

In addition, a user input method is a necessary companion to the display. Even paging through current measurements or error codes can be an invaluable aid to field service technicians.

Animal damage, weather damage, and normal wear and tear will damage cables. Field serviceable connectors can be important for unexpected repairs.

Overall, system design that minimizes tools, cables, software, and equipment required for field activities is an important design priority.

Dyacon MDL-700

This spring, Dyacon is introducing the MDL-700, a fully featured data logger that is modular in design to accommodate a wide range of applications. One unique feature of the MDL is the Linux operating system. Rather than using proprietary software that offers a limited number of features, the MDL can be programmed however the user desires. It is compatible with languages like C and Python out of the box.

We also provide open-source Python based software (pyMDL – https://github.com/dyacon/pyMDL) with the goal of implementing as much of the functionality discussed above as possible. PyMDL is still in early development stages, but should be usable by almost anyone by the time the MDL begins shipping to customers in March.

Since the software is open source, people are welcome to contribute new features or to take the code and customize it to their unique needs.

Summary

No tool is right for every job. Data loggers come in unique flavors for each application.

Please contact Dyacon if you have any data logger questions. We are happy to help if we can or refer you to another source if we can’t.
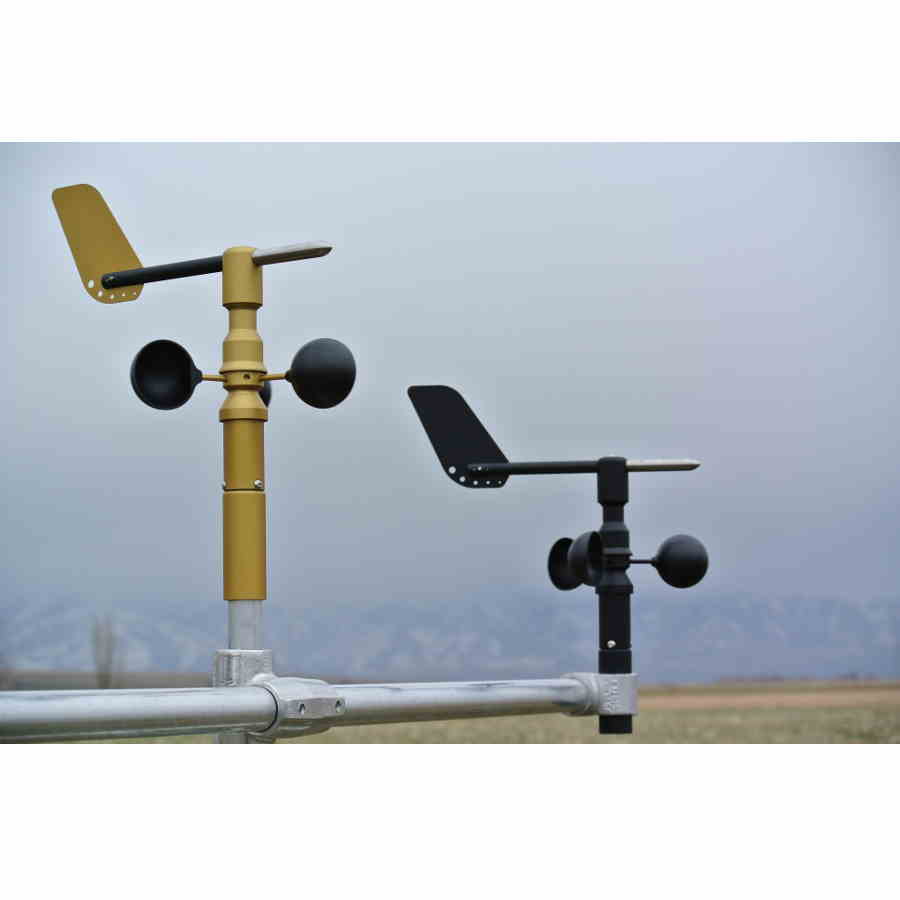


Gold and Black Wind Sensors

Ultrasonic and 3-cup Anemometers

By Uncategorized No Comments

Tech Fascination

When a new technology comes out, it tends to get over-used. Often it is used where it makes a splash, but is impractical.

Blue LEDs for example. The light is a high-energy wavelength. When used on visual displays, such as in your car instrument panel, they can appear brighter than a red or yellow. Consequently, it may be difficult to tell whether the button your are pressing is defrost or A/C. And, speaking of cars, who likes the bright, blue HID head lights??

UAVs are another case in point. As a single-function toy, the shine often wears off before they crash. But, for an industrial user, UAVs can play a valuable role. The practical applications are still unfolding.

Ultrasonic Anemometers

The allure of new technology can be practical as well as trendy. Ultrasonic anemometers offer the potential to resolve vulnerabilities of mechanical anemometers; marketing information often promotes the lack of moving parts.

The notion of a static instrument determining wind speed and direction is rather intriguing. But in a professional environment, fascination for the latest tech must also be tempered with practicality.

Ultrasonic wind sensors are now available across the price spectrum, from a few hundred dollars to several thousand. Like most things, you get what you pay for. Measuring the time-to-travel of a sound pulse is really rather rudimentary; electronics do timing very well. Most products work well on the bench or in “typical” conditions. It is reliability over the board range of conditions that exposes the weak from the strong, the good from the bad, and (generally) the cheap from the expensive.

In addition to the advantage of no moving parts, ultrasonic anemometers can be very compact. The small size can also make them easy to heat.

Since there is no mechanical inertia, ultrasonic anemometers can measure very low wind speeds. But, this does not mean that wind measurements are instantaneous, nor accurate. Conventional ultrasonics can experience spurious measurements at low wind speeds.

Due to the turbulent nature of air, sonic anemometers must take multiple measurements in order to provide a wind speed value. Multiple measurements are also necessary to eliminating noise, spurious measurements, and effects of transducer contamination. The number of sound pulses and numerical processing of these measurements will affect the final value produced.

In some sensors, the number of samples used for measurements is configurable. A 1 Hz rate (once per second) sample frequency is typical. Depending on the sampling and filtering, the resulting value may act similar to mechanical momentum.

Snow, rime, and rain are vulnerabilities of all wind measurement devices. For unheated sensors, the vulnerability isn’t much different and will be affected more by the mechanical design than the measurement technology.

Ultrasonic transducers are affected by rain. That is why most designs have the transducers mounted on a top “hat,” facing downward. Nevertheless, splashing of wind-blown rain inside of the measurement cavity may cause some disruption of the transducer and measurements.

Insects often like dark, protected spaces. Spiders like to suspend their webs between structural gaps. Depending on the insect environment, ultrasonic sensors can create inviting compartments. Bird contamination can also disrupt ultrasonics. The meteorological department of my state department of transportation abandoned ultrasonic anemometers for their highway monitoring due to these vulnerabilities.

While the technology itself may be “maintenance-free,” it does not mean that the equipment does not need to be serviced.

Finally, ultrasonic anemometers are typically expensive.

3-Cup Anemometer

In selecting the right tool for the job, “old” technology shouldn’t be eliminated from consideration.

While many ultrasonic anemometers claim to be “low-power,” they are no where close to mechanical anemometers. For example Dyacon WSD-1 with digital output only draws about 2 mA.  As a comparison, I am not aware of a sonic that is lower than 17 mA. Most that I have seen are in the 30 mA to 60 mA range.

In the power budget, one also has to consider the device that is reading the sensor. So, the anemometer is only part of the equation.

A fully operational Dyacon weather station with cell phone draws less than 30 mA average.

Why is power usage important? Because it impacts the cost of the full system and ongoing maintenance. More power means, larger battery, larger enclosure, larger solar panel, larger brackets, larger shipping boxes, higher shipping cost, and higher maintenance cost.

Birds and bugs typically have no effect on Dyacon wind sensors. A bird may perch on the top for a while, but, due to its slender design, it typically can’t be fouled by what they leave behind. The moving components and small gaps are not susceptible to insect fouling.

Ah, but, what about the wear components?

Unlike most wind vanes, Dyacon uses a magnetic sensor. The anemometer itself uses a reed switch. Both are non-contact elements. Yes, the bearings can become contaminated. A service interval of 3 to 5 years is recommended, depending on the environment. Until that time, all you have to do is visually ensure that the components are moving. This makes for intuitive troubleshooting.

Dyacon wind sensors are mechanically robust. Our sensors have survived a number of falls and bird impact. The cups are replaceable in the field. The aluminum mechanism ensures reparability, protecting the user’s investment.

Summary

Two main points:

  1. Select the right tool for the job. Both of the above technologies have their place.
  2. The wind sensor is only one piece of the system.

We strive to provide professional equipment for the commercial and industrial environment. Not only is our equipment robust, with good connectivity options, it is generally easy to use. This allows users to install, configure, and maintain the equipment, minimizing both down time and total cost of ownership.

Please drop us a note.

Eugene

Hurricane Test #1 – The Dorian Job

By Blog, Uncategorized No Comments

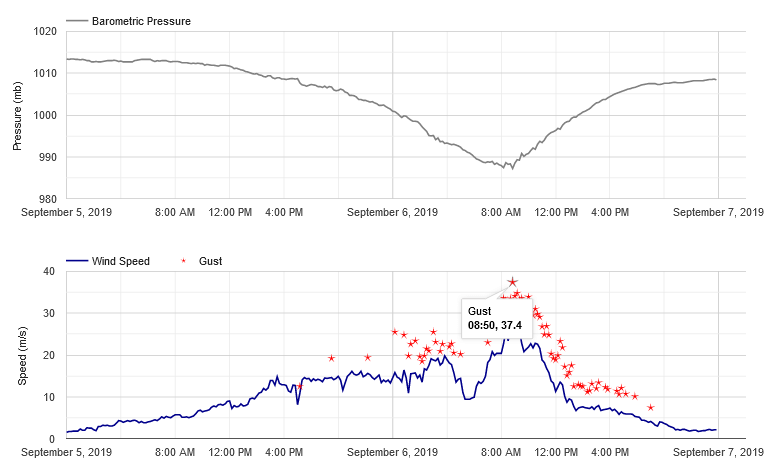
Wind tunnel testing has its place, but the real-world can be a bit rougher, like hurricane Dorian rougher. Well, maybe that sound a little hyperbolic, but 84 mph wind is still quite a bit.

Our customer reported: “The two Dyacon met stations we currently have running made it unscathed through Hurricane Dorian that just hit us. Max recorded gust from the Dyacon stations was 37.4 m/s (84 mph). . . . Not sure if this is the first CAT 1 hurricane the sensors have been through, but thought you may be interested to know.”

Dyacon sensors have been tested beyond 84 mph on a mobile platform, but this was the first time we have seen this speed in the wild as part of a full weather station.

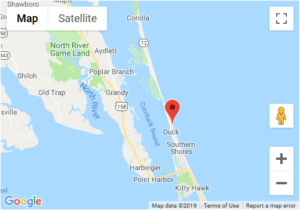
The map shows the location of the weather station in North Carolina.

USACE Station Map

The charts below are from DyaconLive. The peak gust measured was 37.4 m/s (83.7 mph). The maximum 10 min average at the same point was 26.9 m/s (60.2 mph).

USACE Huricane Dorian Wind Chart

The user has enabled the public page. So, you’re welcome to take a look at the weather station page.

USACE #2

The weather station configuration deployed at this site is Dyacon MS-130.

Eugene

Telematics-M2M-IoT

By Uncategorized No Comments

Back Up (beep, beep, beep …)

For those of us that have been around the block a few times, it seems like the same (or slightly evolved) technology picks up new names every few years. An observer might think that there must be a Global Market Stimulation bureau somewhere dedicated to reinvigorating technology that they think should be adopted. (Or, maybe marketing people think we won’t noticed that they just changed the name on the same stuff.)

Dyacon began when the rugged, on-board computer products division was separated from the parent company. At the time (2007), the concept of automated data communications from a fixed or mobile asset was called telematics. This was intended to be a little more board than “telemetry,” which would typically just mean the transmission of measurement data.

Later, this evolved into machine-to-machine communication. That name was too long, so it was shortened to M2M, which sounds more trendy.

That still didn’t seem to capture the imagination of society, so Internet of Things was invented. Again, the name was too long, so it was initialized to IoT. Yet, my toaster is still dumb (which I prefer) and my car still has a cassette player (which I don’t prefer since it ate my Simon and Garfunkel Greatest Hits tape–now all it plays is silence). (If you didn’t get the “silence” reference, you probably haven’t heard “telematics” either.)

On-Board Vehicle Computers

Like general telemetry technology, mobile asset telematics has included a similar range of names and applications over the years including: AVL (automatic vehicle location), EOBR (electronic onboard recorder), and ELD (electronic log device).

Dyacon continues to design and manufacture open-programmable computer products for the vehicle telematics market. These products are now branded under ControlTrac.

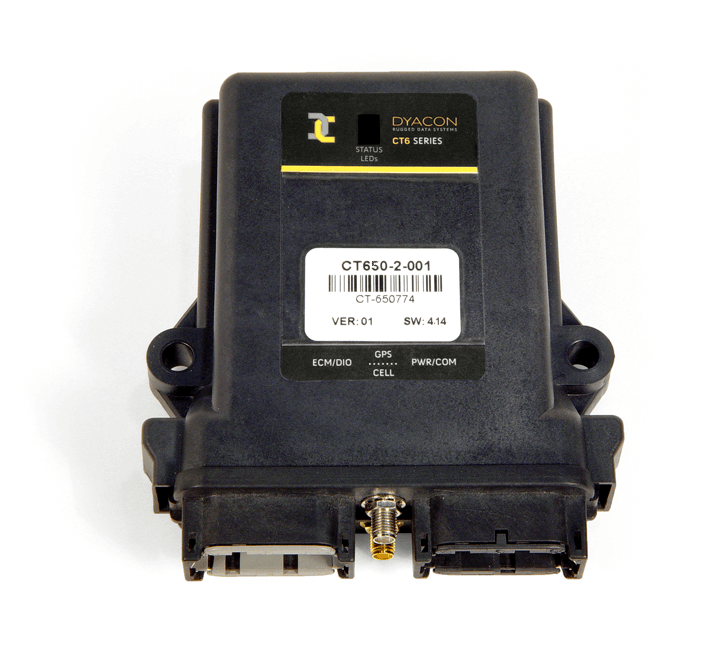
CT650 is our latest on-board computer. Unlike off-the-shelf industrial computers, CT650 is purpose-built for the vehicle market. It utilizes automotive connectors, is sealed, and compact. The I/O is dedicated to in-vehicle telematics/M2M/IoT applications. So, you won’t find “desktop” on our box; these don’t hold up to the vibration, dust, and abuse of a vehicle environment.

CT650 uses our own custom build of Linux, leveraging the ease-of-use and versatility of an open system, while still providing for unique features. The embedded cell phone, embedded uninterruptible power supply, digital I/O, CANbus (SAE J1939), and multiple communication ports provide an all-in-one computer solution; no external converters or power supplies are required.

ControlTrac computers tie to the vehicle data bus (engine control module) and peripheral devices in order to monitor vehicle activity, operating parameters, and auxiliary sensors. Data may be communicated to the vehicle operator or transmitted by cell phone network or satellite.

Integrators

If the above makes sense, you probably recognize that CT650 is only one part of a larger system and integration project.

Dyacon onboard computers are sold to fleet service providers, which usually employ a team of software developers to provide a complete solution to the end users.

So, if you are providing asset management, road-weather information systems, mobile vehicle diagnostics, messaging, or routing information to fleet managers, Dyacon CT650 may be the right tool for your solution. ”

Eugene


GDD Chart w-Freeze

DyaconLive v1.19

By Blog No Comments

DyaconLive is an ongoing project. We want your weather station to provide usable, actionable information. The Grower’s Report is a case in point.

v1.19 Summary

DyaconLive release version 1.19 on 15 July 2019 included the following improvements.

  • Grower’s Report now includes an upper temperature threshold and last freeze marker.
  • Charts added for new IRT-201 infrared temperature sensor.
  • Sunrise/sunset added to Weather page.
  • Improved screen size responsiveness for mobile devices.
  • And, some back-end work, which is always going on.

By the way, Chris Cox, our staff scientist and DyaconLive developer deserves a big pat on the back for his work.

Improved Responsiveness

The navigation menu at the top of the screen should collapse into an icon on smaller screens.

Personally, I’m not a fan of the three-line, hamburger icon, it’s a bit ambiguous. But, when your computer has to fit in the palm of your hand, there isn’t much choice.

This may work better on some devices than others. Let us know what you find.

Grower Report Improvements

When setting the Grower’s Report, the upper threshold is added in a new field. For some crops, such as corn, hotter does necessarily mean more growth. The upper threshold is capped at this value. (Upper threshold is not required to generate GDD.)

Grower Report Settings

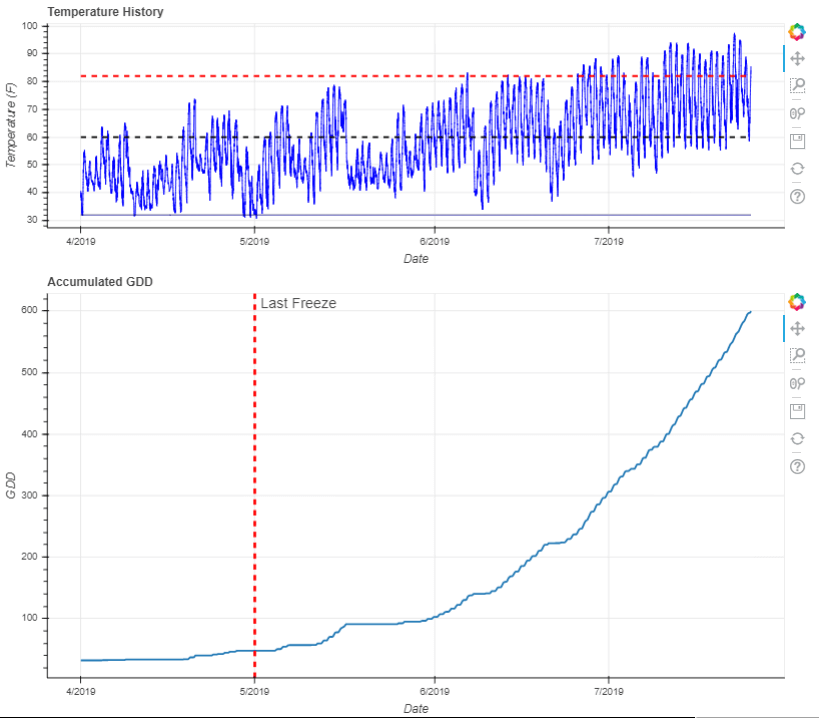
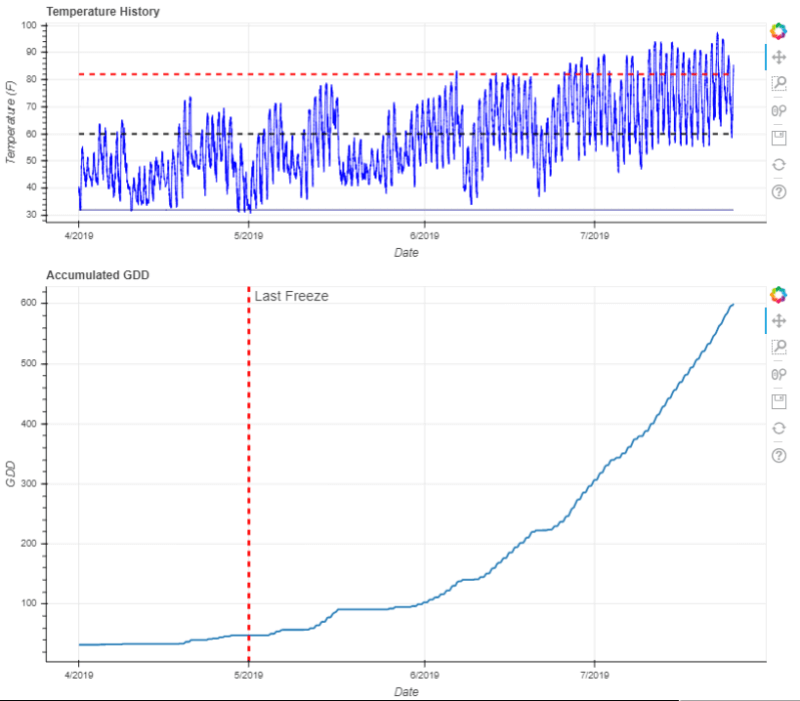
This upper threshold is shown on the temperature history chart.

The Last Freeze value is shown on the GDD chart.

GDD Chart w-Freeze

If you have other reports you would like to see, please let us know.


Eugene

Light Theme, Weather Station Display

In The Dark

By Blog No Comments

I’ve worked in cubicle environments where windows were scarce. In fact, in one job as a product design engineer, my desk was in the server closet; no windows, constant fan noise, and plenty of heat. Fortunately, I could get up a few times a day and walk outside. However, the owner’s desk was by the only entrance. So, to go outside for some light, you were advertising that you were not at your desk. And, if that wasn’t enough, he had cameras covering the whole work area so he could keep an eye on you even at your desk.

Of course, it could be worse, some people work in underground buildings; no windows and no outdoor strolls to keep one in touch with reality.

A Dyacon weather station was sold to just such a place. Not only is it underground, but there is no internet connection and no wireless was allowed. Dyacon Weather Station display software was included with the weather station purchase.

Weather Station Display is displayed on a computer monitor in break room areas, along with closed circuit camera images. The intent is to provide employees with some contact with the surface conditions.

Weather Station Display software not only meets the needs for a simple weather station interface, but also connects directly to the weather station. For security and practical reasons, wireless was not an option.

So, if you are in the dark regarding weather, Dyacon has an answer.

Eugene

Infrared Temperature Sensor

By Blog No Comments

*NOTE: This blog post is out of date. Some information may no longer be relevant.*

We are always working on one development or another, whether DyaconLive, new sensors, new [secret stuff], or expanding the capabilities of existing weather station capabilities.

Recently, we were contacted by an organization that needed a reasonable cost solution for a heat-island study. The goal was to collect baseline pavement surface temperature this year, apply new surface treatment, and then measure the difference next summer. The system had to provide real-time data to a web portal as well as local data logging.

So, we went to work; leveraging our CM-1 weather station controller and DyaconLive in order to deliver the functionality required in the short time frame.

First Test Of Infrared Thermometer

It’s always fun cobbling together the first system and giving it a spin. Often we are enamored by its inelegance. As the images attest, this is definitely not elegant. But, that comes with time. At this stage, the data is most important; and, Chris, our staff scientist, is whiz at collecting data and building scripts for analysis.

Infrared Thermometer Applications

In addition to the heat-island study at hand, there are a number of applications that we can see for this new device.

Sub-surface temperature modeling

Foliage and crop canopy temperature

Ground temperature

Road surface temperature

Race track temperature

Roof temperature

Storage tank surface temperature

Outdoor sport court temperature

I’ll leave you to come up with more applications for an infrared temperature sensor for your business. Give us a call if you want to explore anything in particular.

The measurement temperature range of this device is -20 °C to 1000°C (-4° to 1830°F), which is quite a spread. While the maximum temperature is inadequate for plasma furnaces, it is high enough to monitor your local lava flow.

Please check back later. I’ll add more to this post as we make progress toward product release in August.

Eugene

Weather station data to cell phone

DyaconLive Growers Report

By Blog One Comment

DyaconLive provides our customers with an easy to use website for staying up to date with current weather conditions and makes it easy to download historical station data. However, we know that for many applications weather data is just the first component of more in depth analysis. Indeed, the key value provided by a station may not necessarily be the raw measurements, but rather the derived quantities that can provide actionable information. The question a business owner faces might not be “What is the temperature?” but rather “What is the trend in average temperature?”.

At Dyacon, we strive to facilitate this need for actionable insights. As part of this effort, we are introducing DyaconLive Reports. These are application-specific reports that are downloaded from DyaconLive and provide sophisticated data analysis in a user friendly interface.

One of the reports now available on DyaconLive is a “Grower’s Report”. This report is specifically targeted at agricultural producers and helps monitor crop growth by calculating Growing Degree Days (GDD) (https://en.wikipedia.org/wiki/Growing_degree-day). GDDs are calculated from air temperature measurements above (or sometimes below) a certain threshold.

Mathematically:

This equation is often simplified by using daily max/min values. Temperature is an important factor in plant and insect growth, so GDDs provide a means of evaluating when a particular crop or insect will reach maturity. This helps grower’s anticipate problems and plan for harvest.

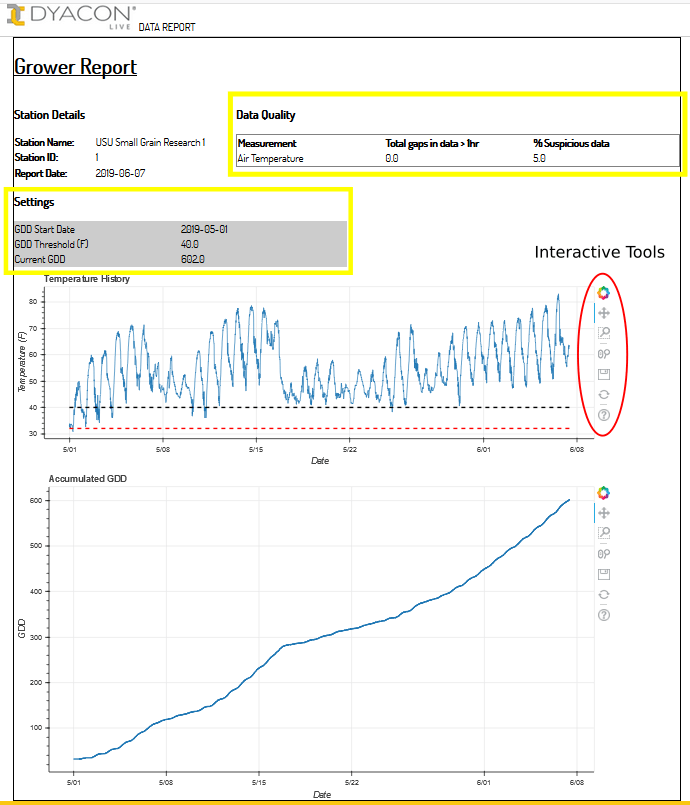
The figure below shows a typical Grower’s Report for one of Dyacon’s test stations in Logan, Utah. The key components of the report, common in many different reports, are highlighted yellow. Near the top is an overview of station metadata and the dates associated with the output. A data quality assessment table is displayed next to the station table, and this is arguably one of the most important components of any report. Without good quality input data, the report output is meaningless. Input data quality is assessed automatically by the DyaconLive server when the report is generated. Measurements are assessed for reasonableness in terms of data values, behavior, and in some cases consistency with other measurements. The details behind these algorithms will be discussed further in a future blog.


The main output of the report consists of a summary table detailing settings and totals, and interactive charts for visualizing report output. The Grower’s Report charts temperature over the report timeframe and shows where the GDD threshold is located relative the temperature measurements. The GDD chart shows accumulated GDD and how it is changing through time. Users can assess current GDD values to determine how their crop is maturing.

Weather Station Requirements

  • Temperature
  • DyaconLive connection

Compatible Dyacon Weather Stations: MS-120, MS-130, MS-135, MS-140, MS-150

The only measurement required for this report is air temperature, which should be present on all Dyacon meteorological stations. It is worth noting that other reports will require a wider variety of instruments not present on every station.

How To Generate Your Report

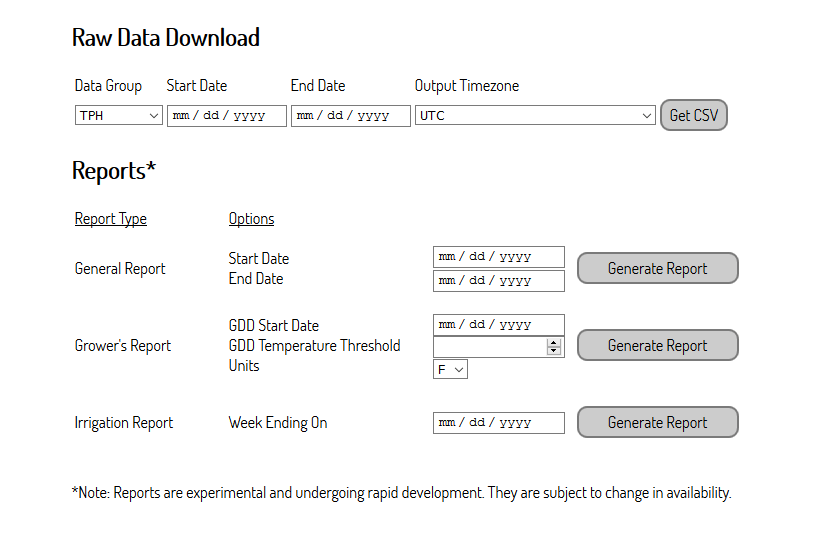
Report generation currently requires Manager or Admin level access to DyaconLive.

  • Log in and navigate to the “Reports” section of the Data Page for your station.
  • Select a start date, temperature threshold, and temperature units.
  • Select ‘Generate Report’ and the report will be displayed in the browser.

Chris Cox

WiFi Weather Station on HughesNet

By Blog No Comments

Unlike large companies, Dyacon “market research” comes through customer feedback and requests. We have received several requests over the last couple of years to develop a WiFi weather station. Well, we’ve finally done it. (Yes, sometimes we are slow.)

While WiFi seems like a logical step, the implications of a short-range radio connection bring installation, data distribution, and support complications we were not ready to address at the time. Now, with DyaconLive in place, we can provide the data accessibility that users expect.

Remote WiFi

We typically think of WiFi as a short-range, local data communication mode, but with the right equipment, WiFi can cover a relatively long distance and operate in remote locations.

A property development in western Wyoming contacted us for a weather station for their private runway. While they didn’t have cell phone service in their remote mountain location, they did have HughesNet satellite Internet service. Using a 2.5 GHz outdoor access point, we achieved one mile range. This meant that the weather station could be located at mid-field by the runway.

The low data rate requirements of the Dyacon weather station means that there is no significant impact to their HughesNet account. Dyacon equipment also does not need a static IP, allowing a lower cost Hughes service plan.

Normally, our users do the equipment installation. In this case, we were contracted to do the installation (and I’m always happy to get out of the office and work in the field). Since we hadn’t previously done a connection over HughesNet, I was glad to participate in the installation.

The following are a few images from the adventure.

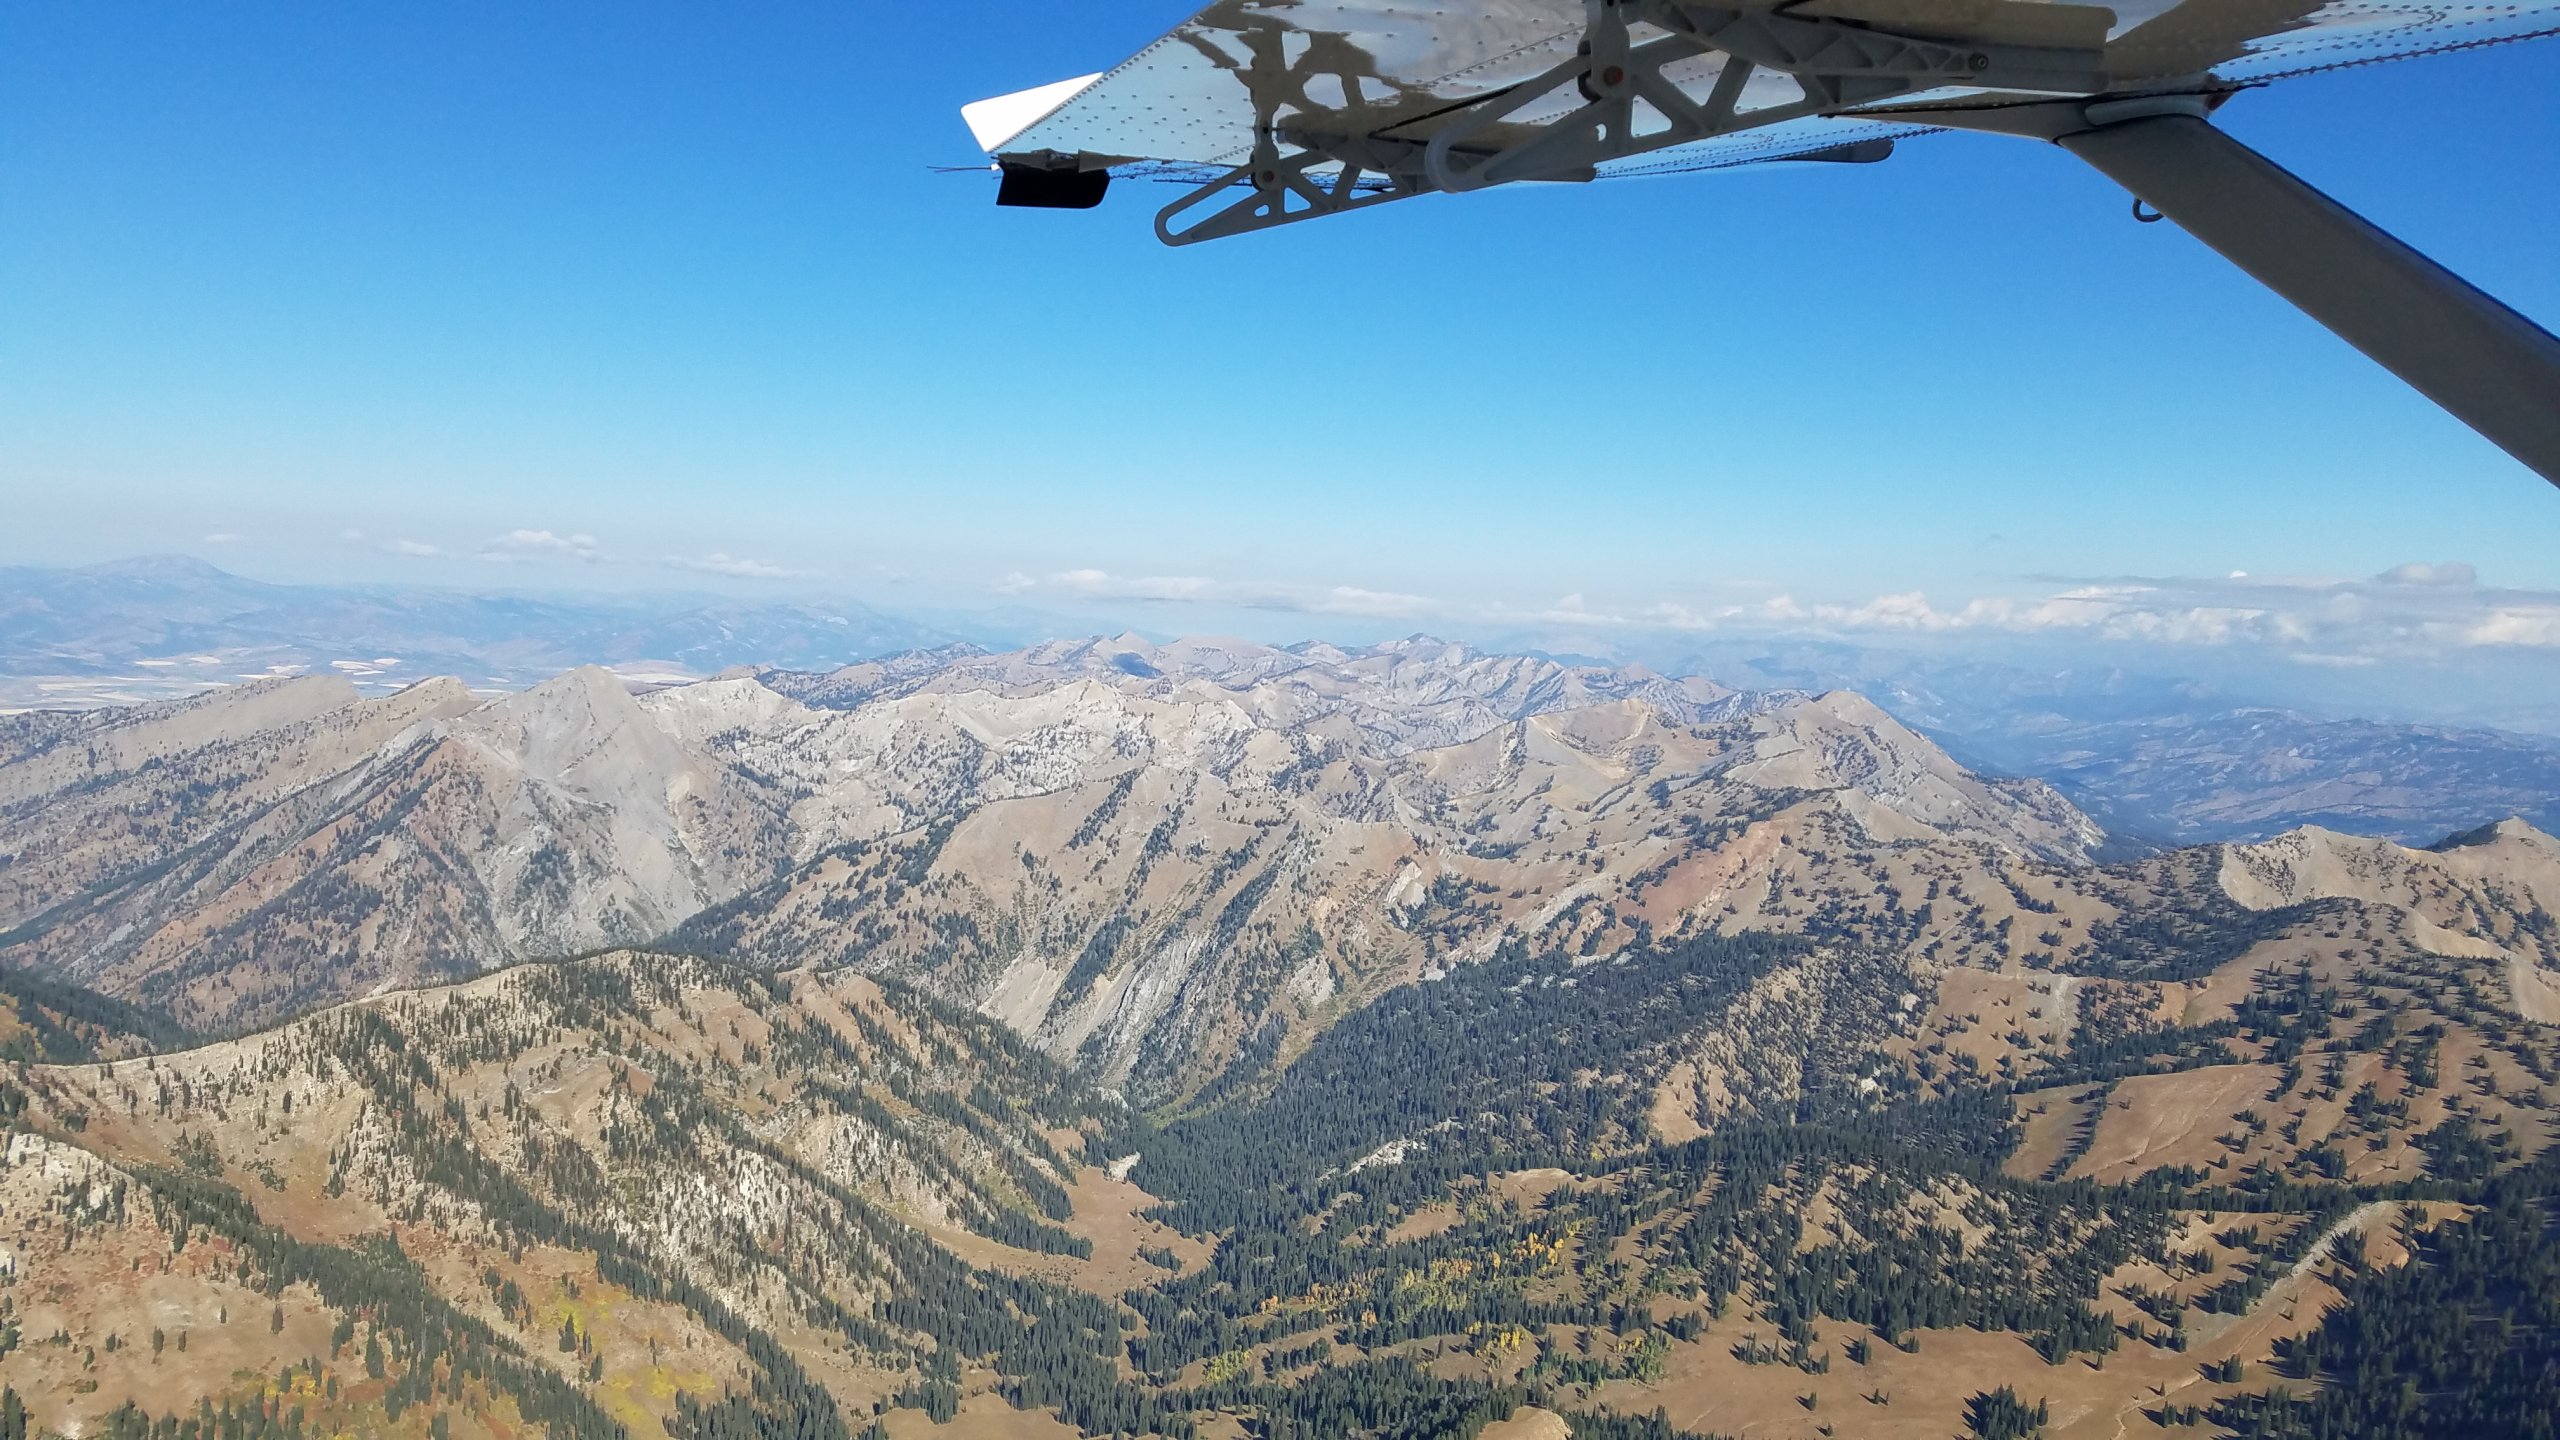
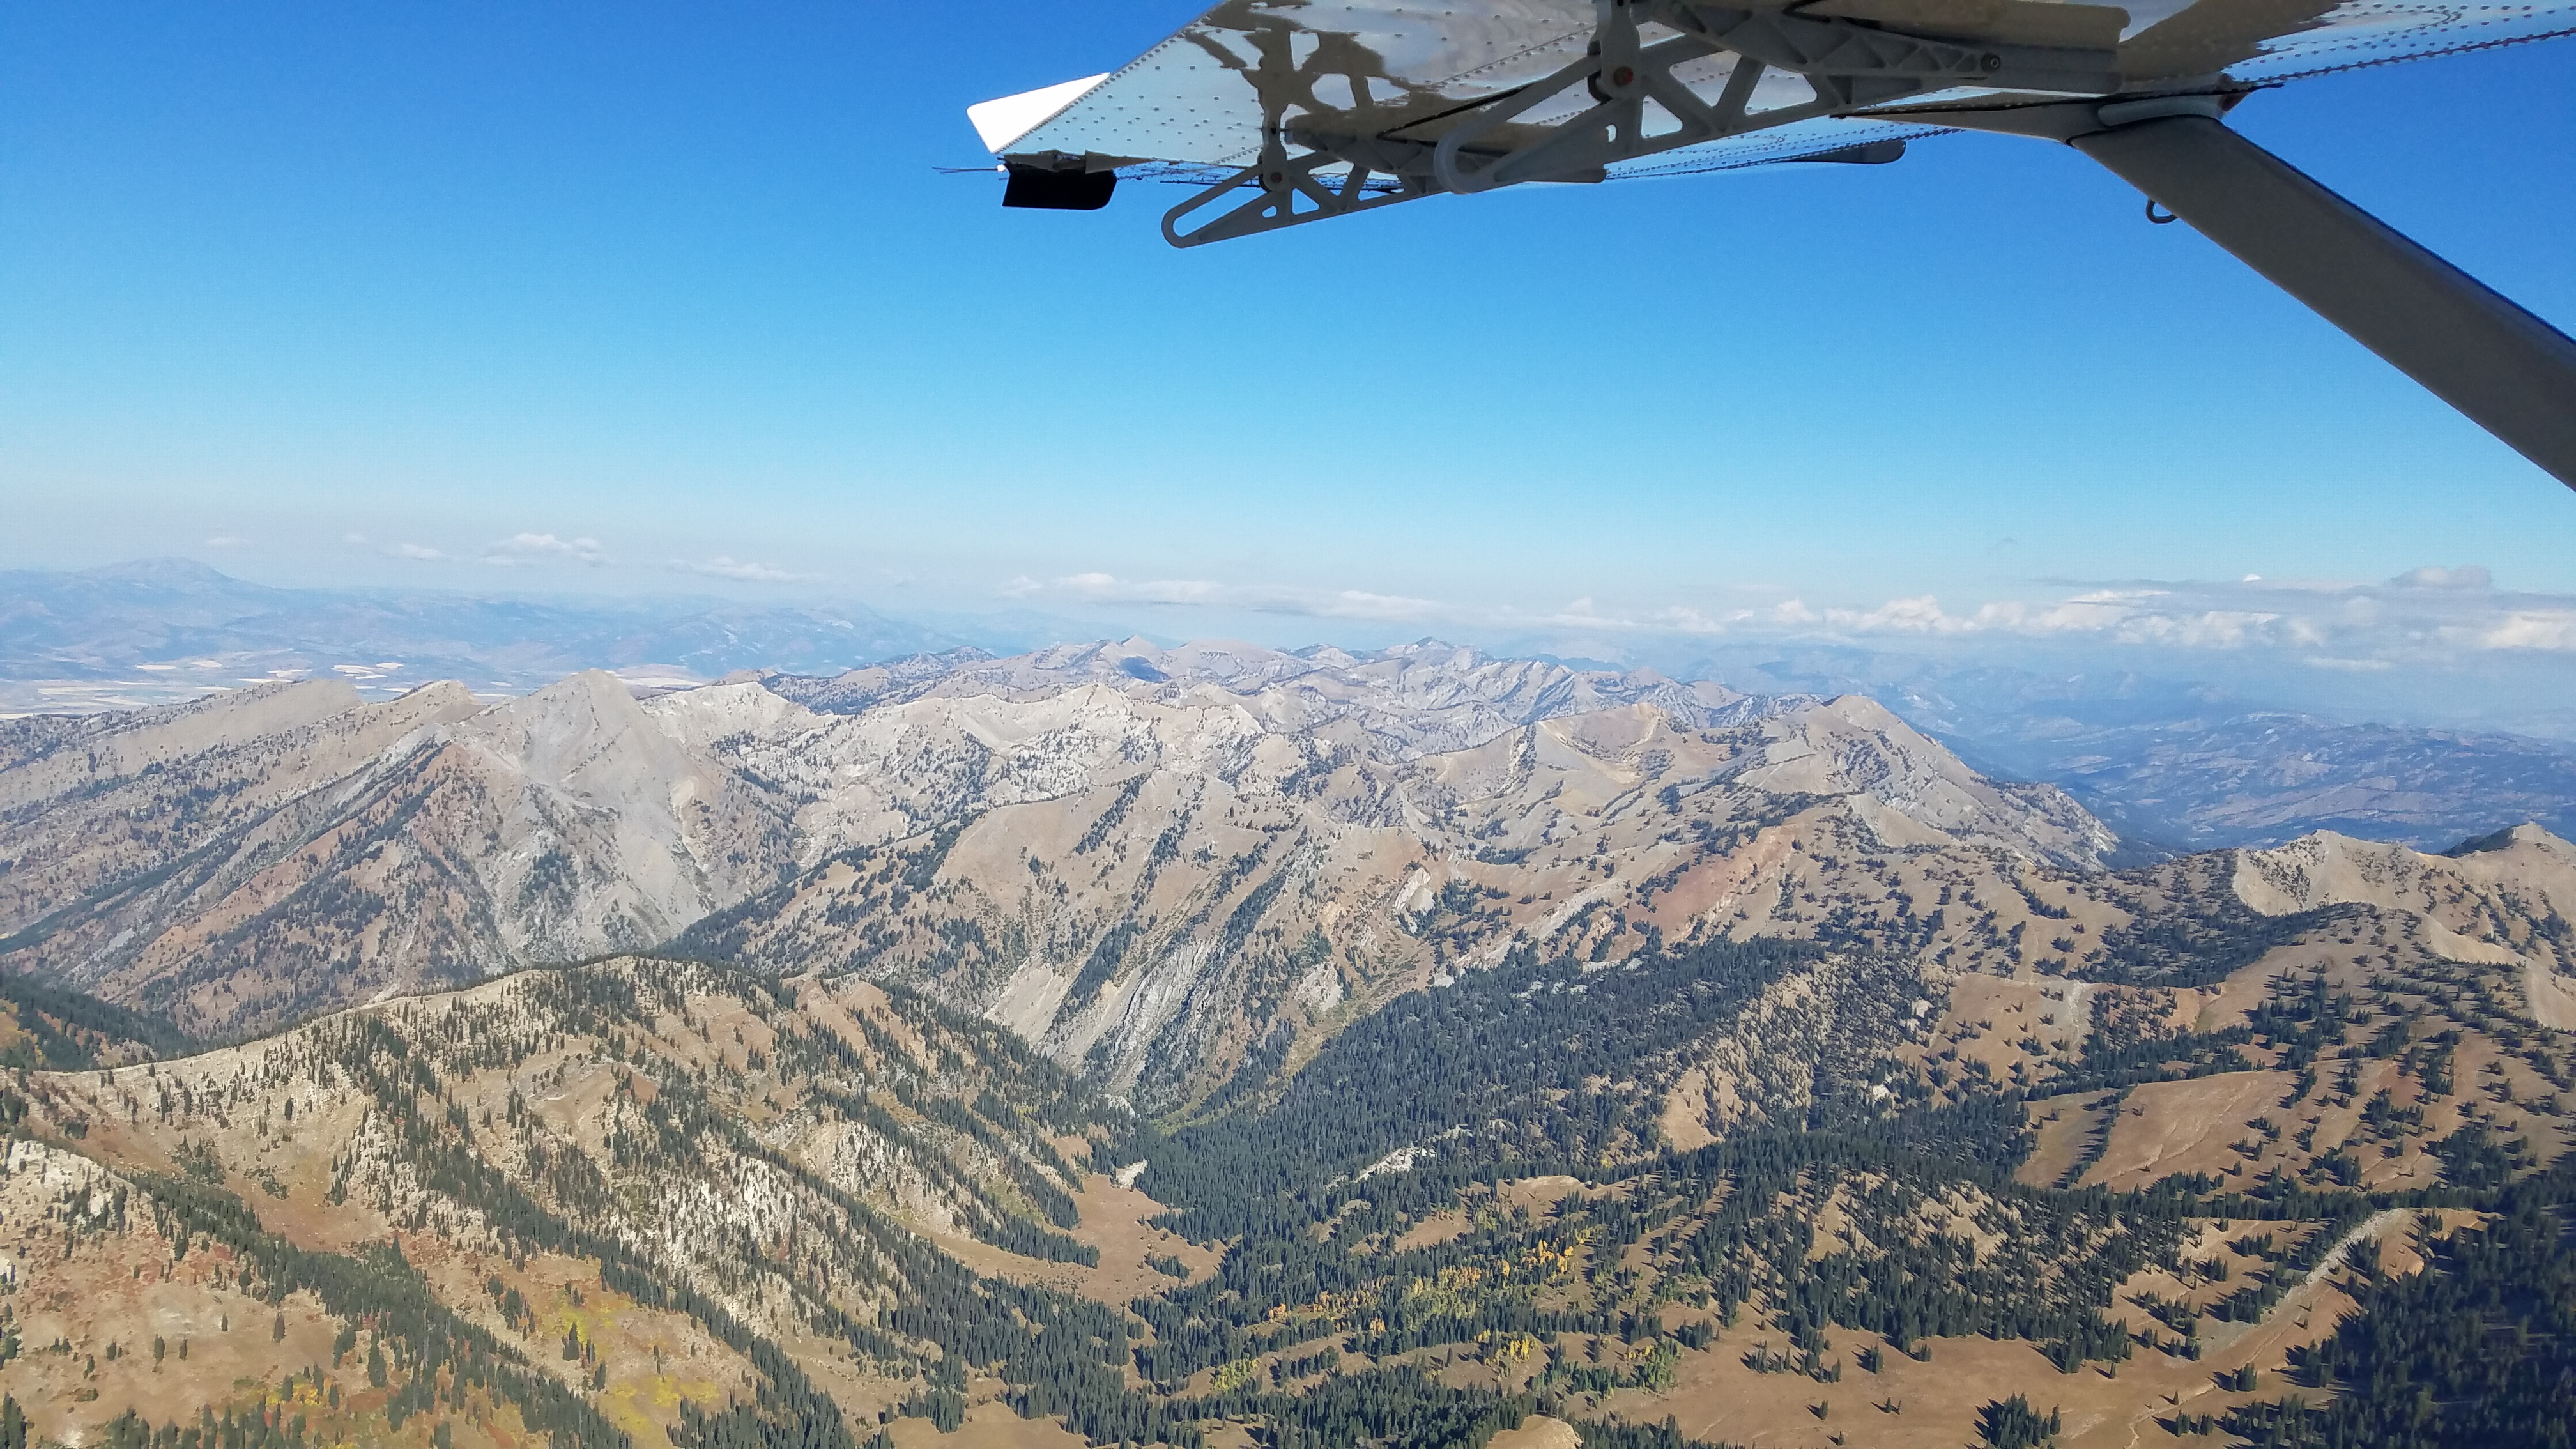
The flight in – 15 min by plane or 1.5 hrs by land. In this case, we flew in and drove back.


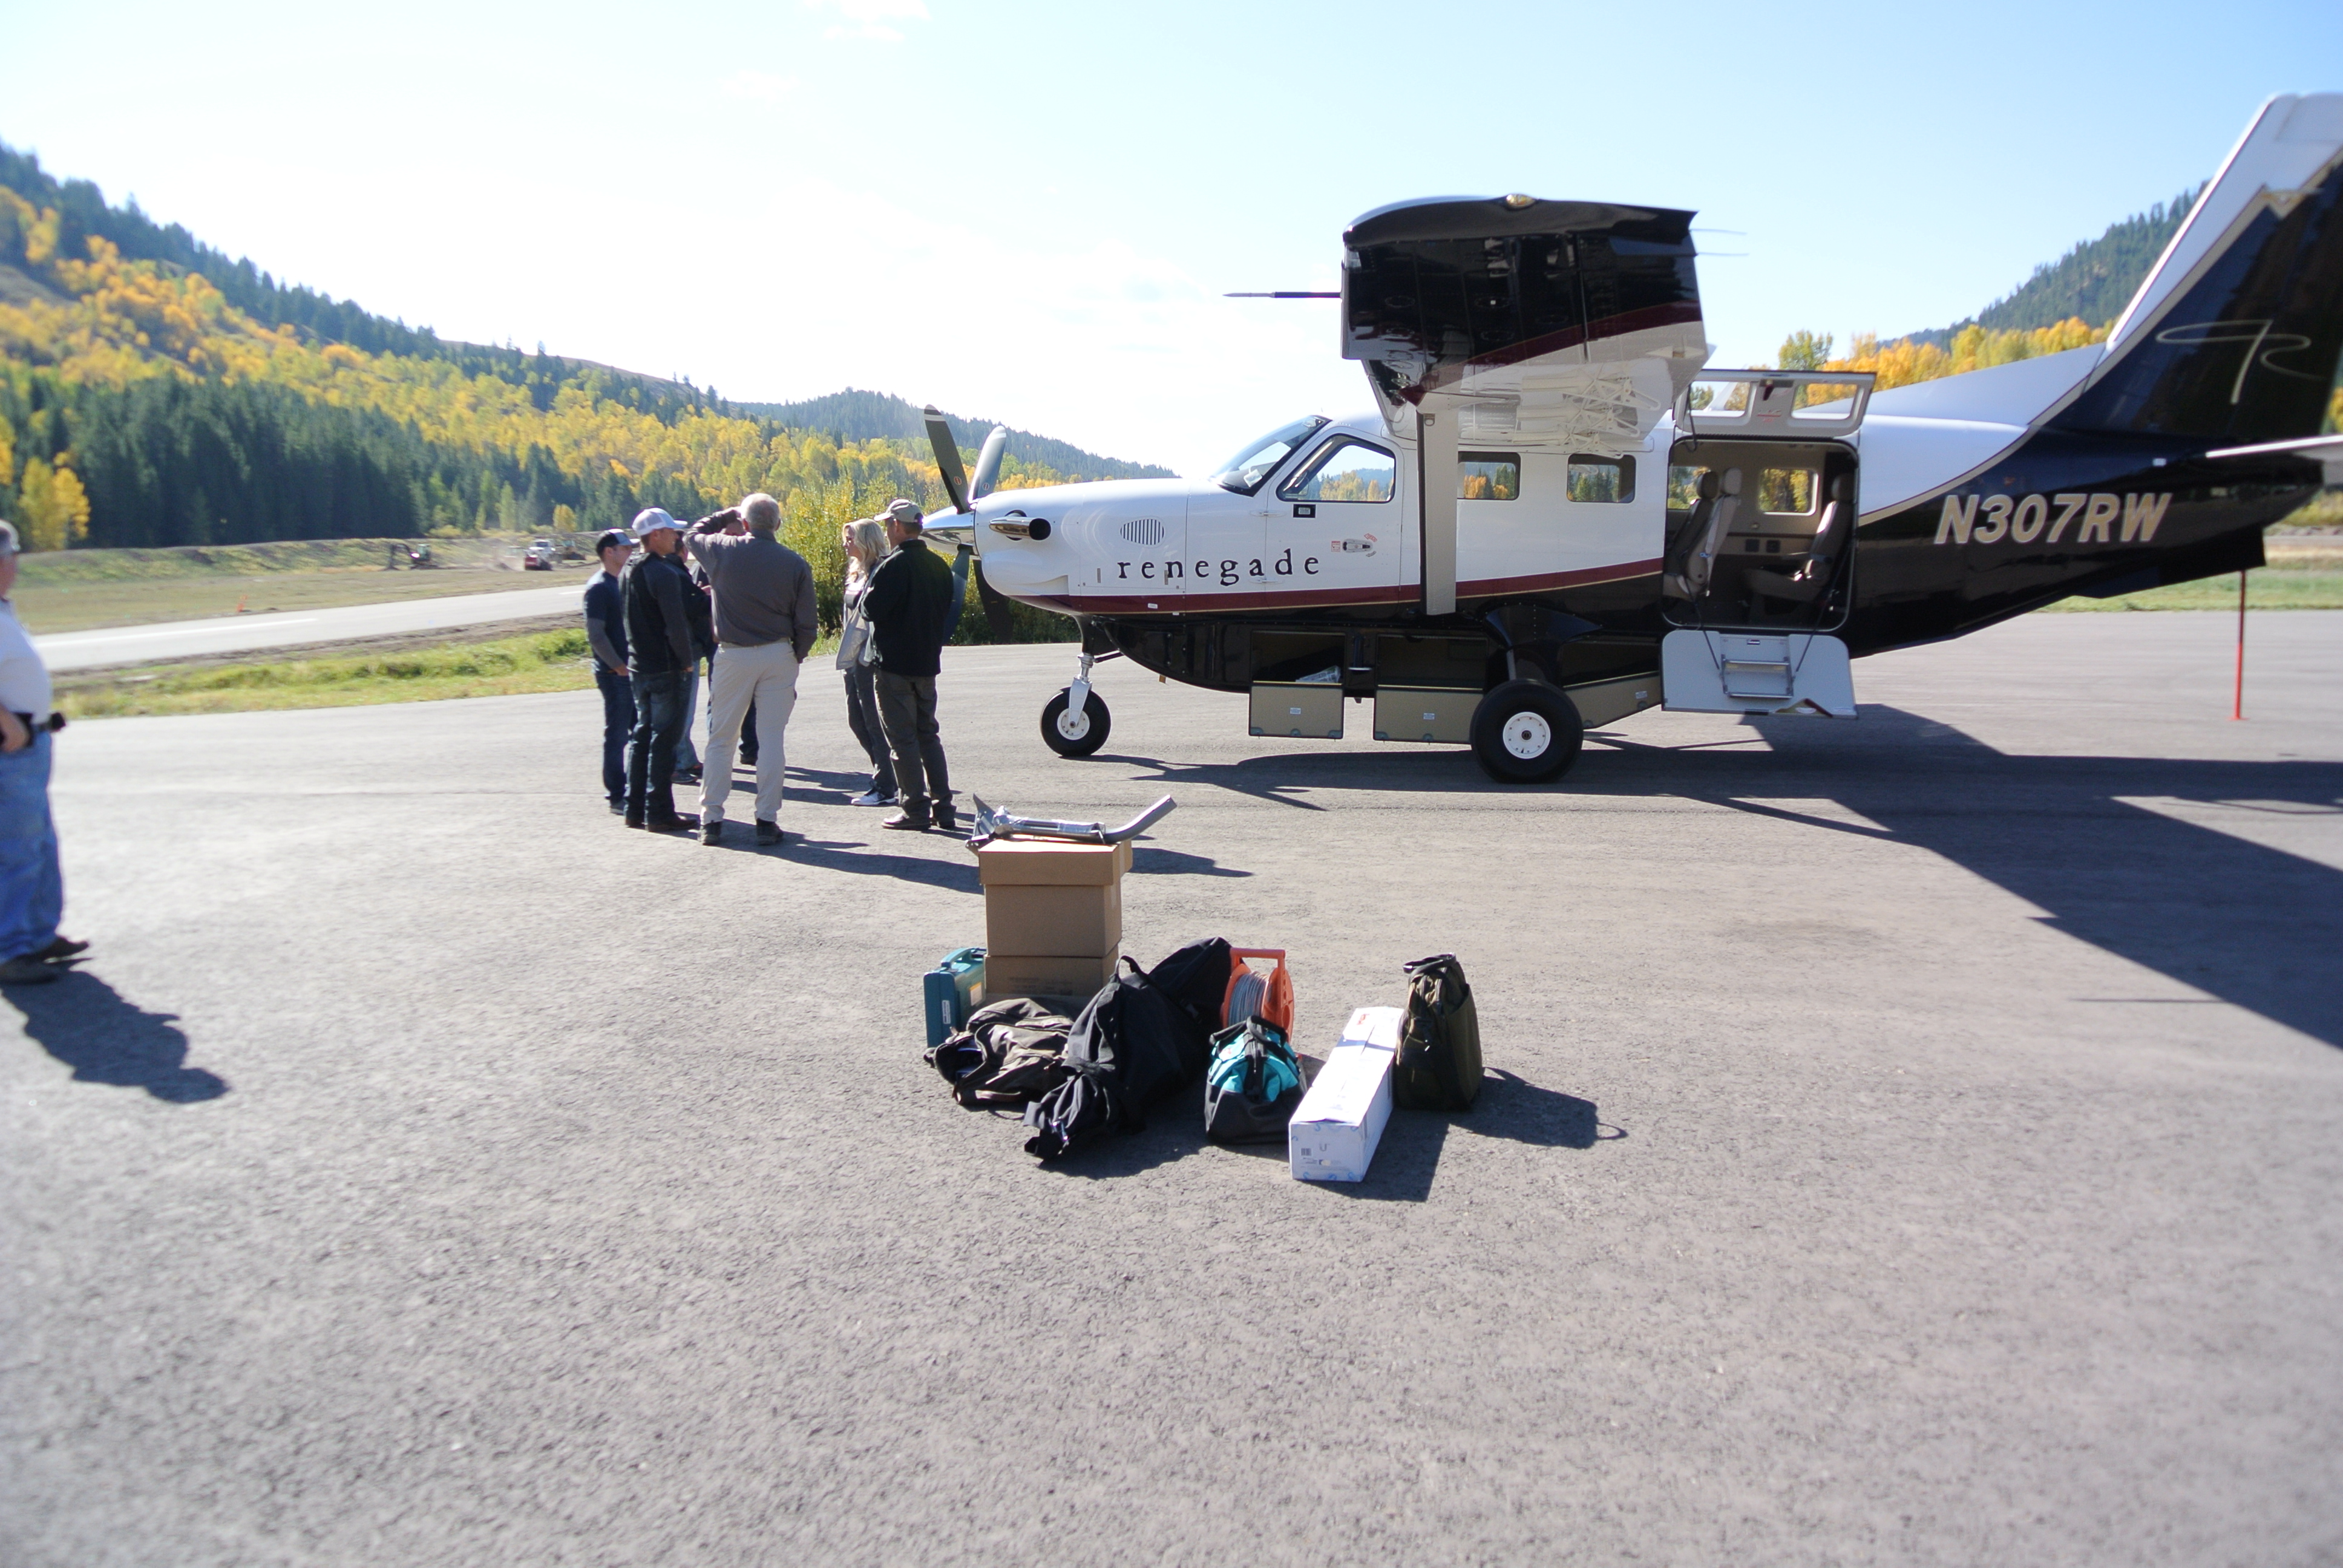
Weather station and access point offloaded and ready to go.


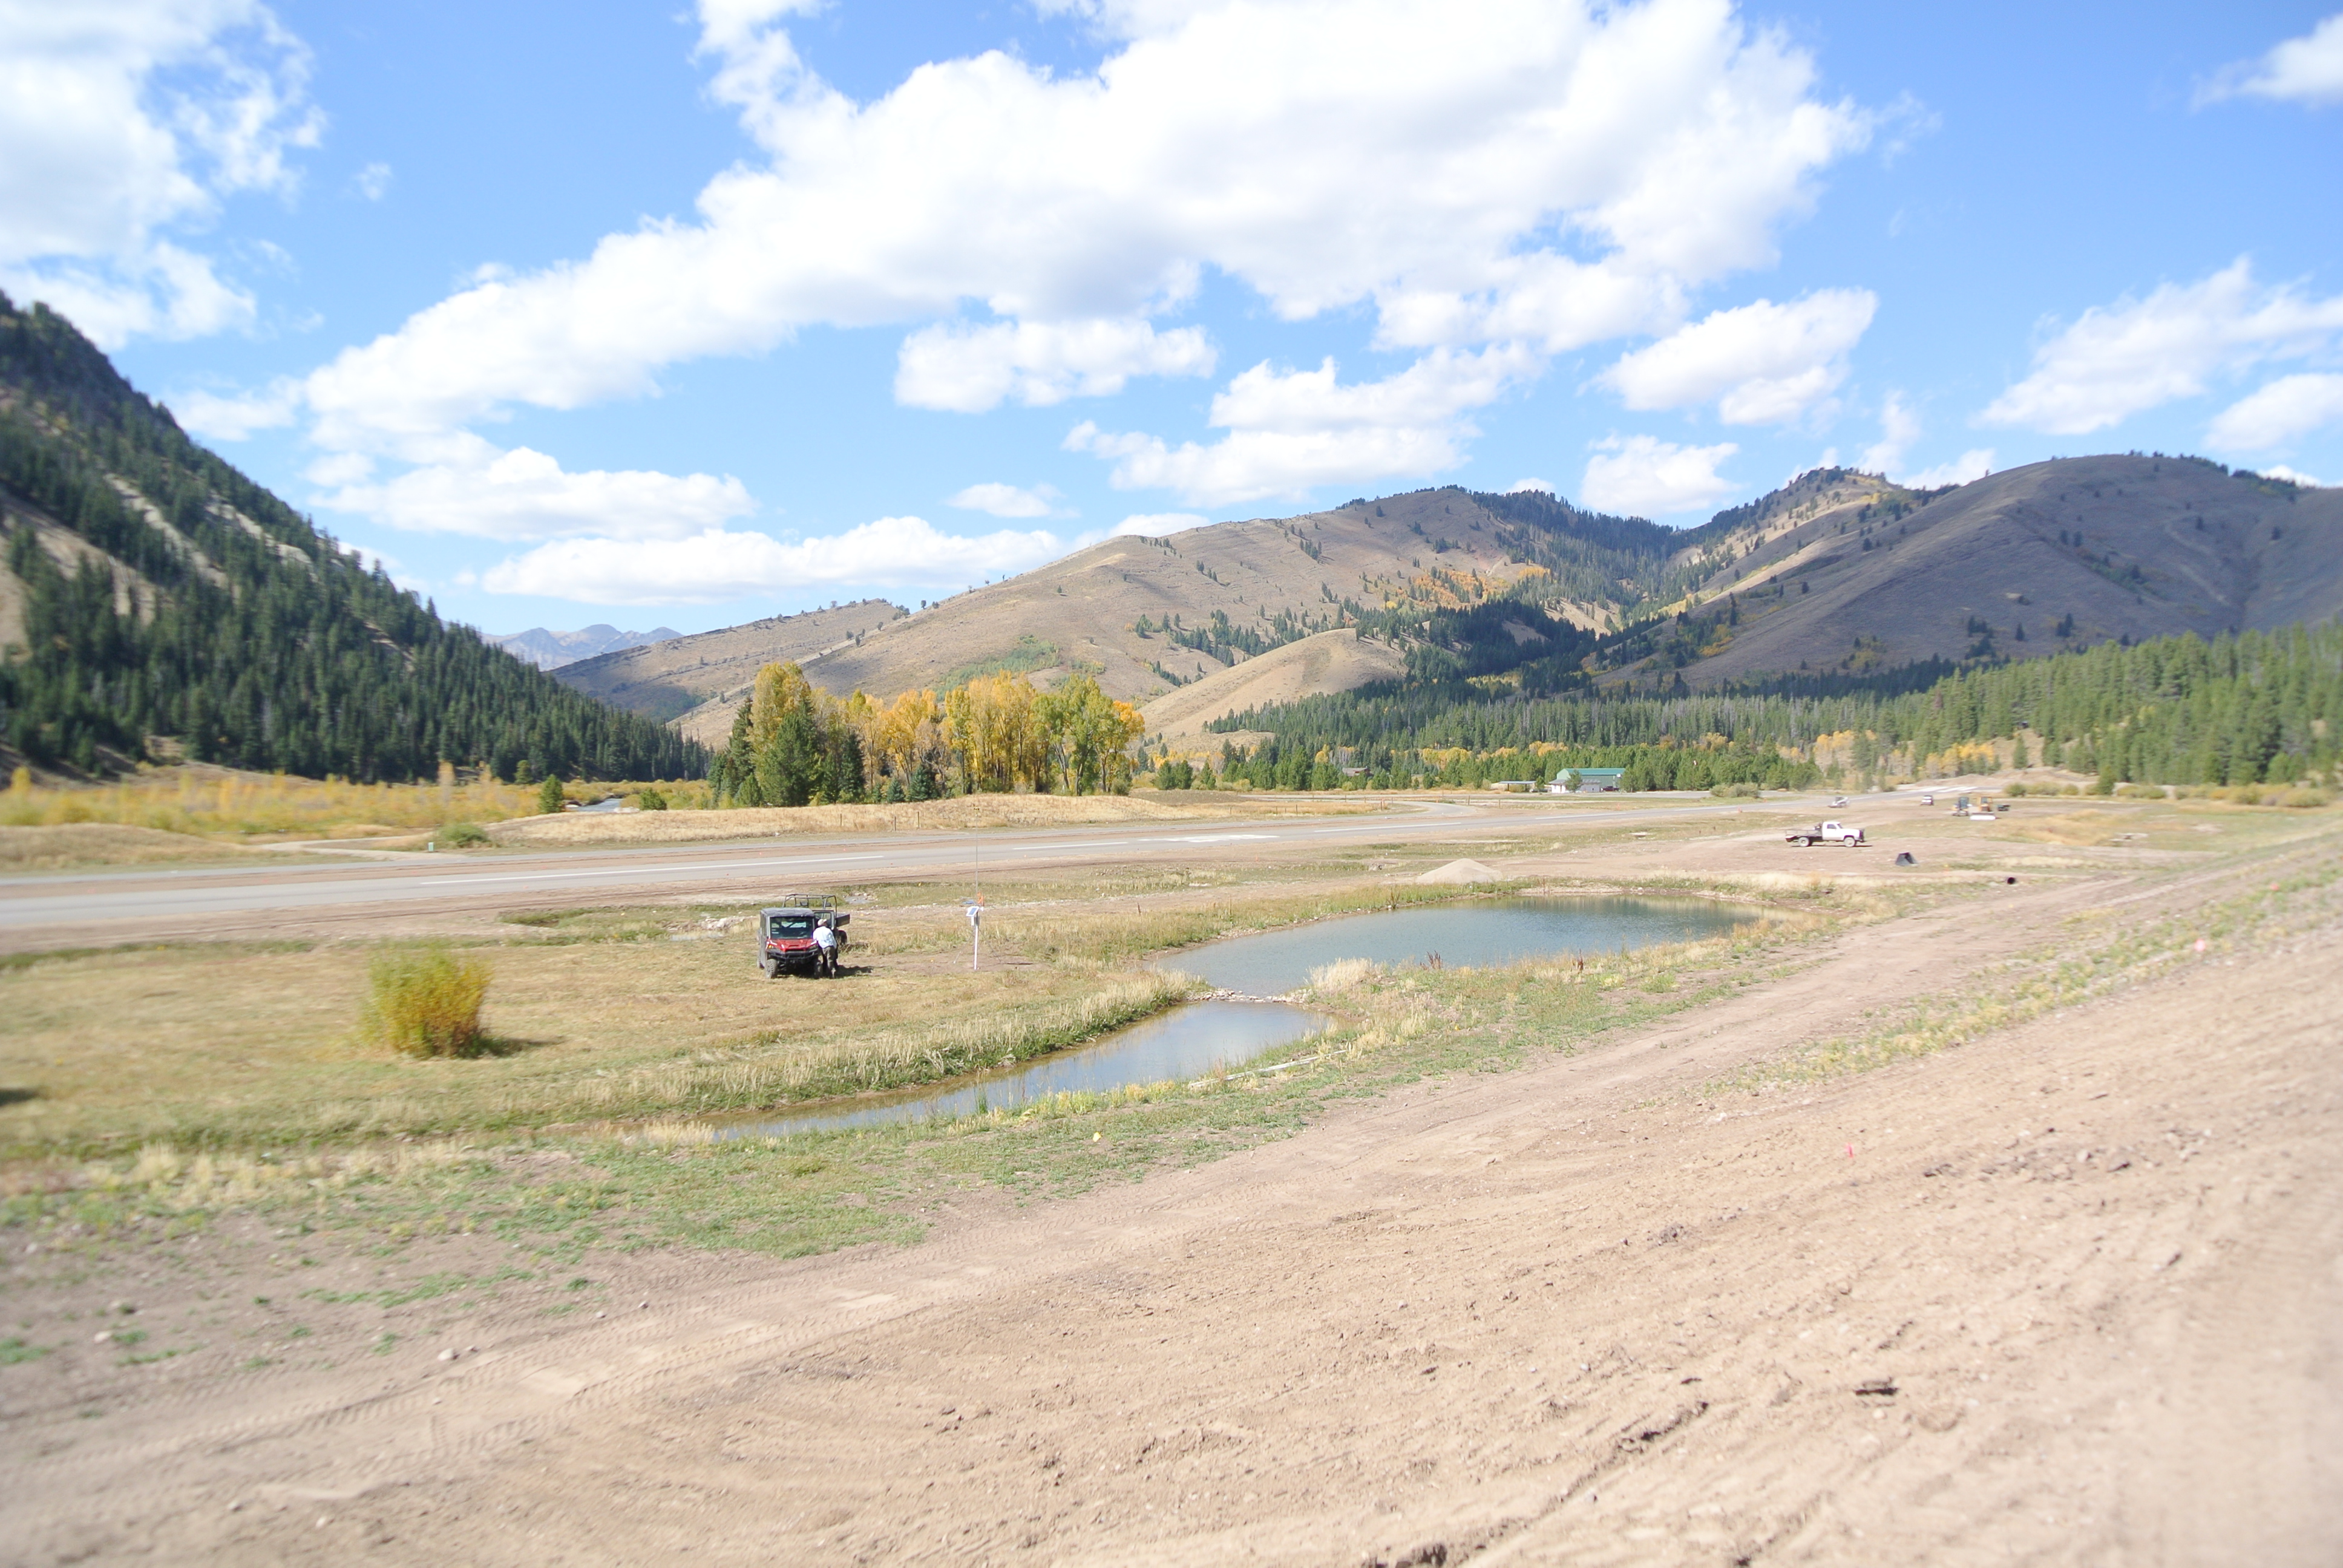
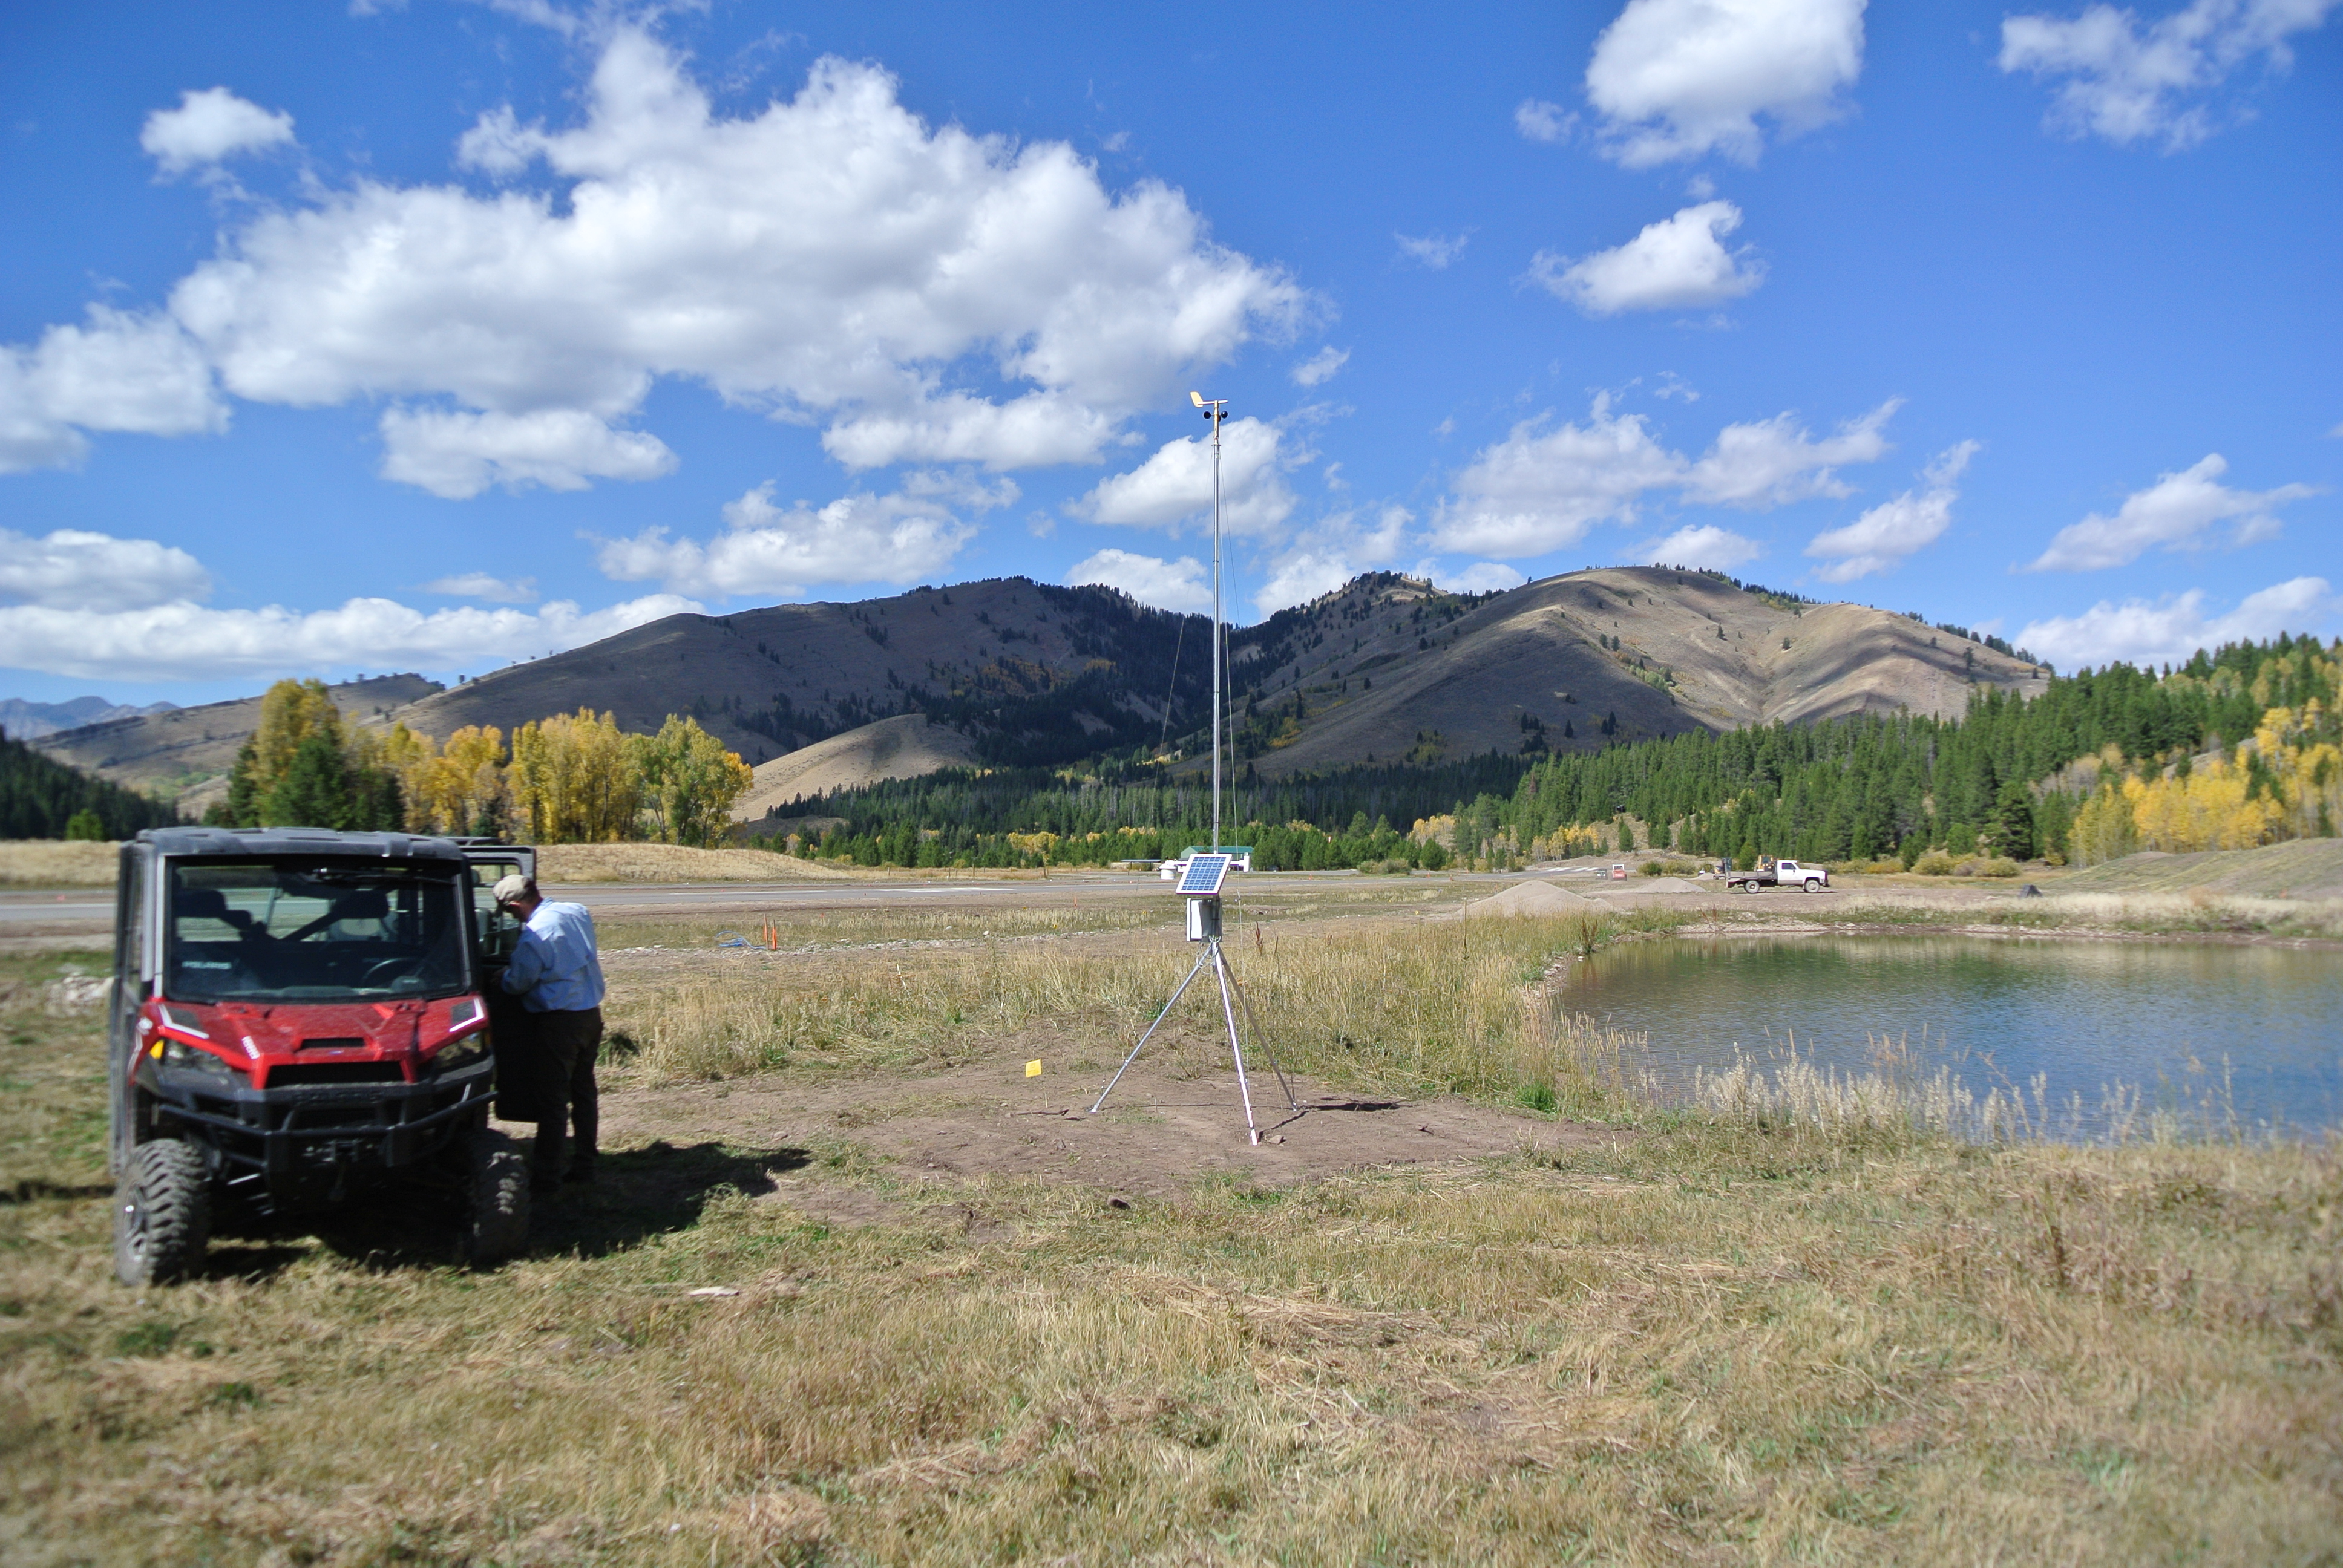
View of runway, weather station, and utility shed in the distance where the access point is installed.


Dyacon weather station installed and transmitting to DyaconLive.

If you have similar needs for a WiFi weather station, please give us a call. We would love to see what we can do for you.

Eugene

Burning Man Weather Station

By Blog No Comments

Building a functional, temporary city in the desert every year is a remarkable challenge. The Burning Man organization does a remarkable job of pulling off one of the biggest and most challenging events in the world. Throw in a temporary airstrip (88NV) with thousands of aircraft flights and you now have a unique challenge that most event organizers don’t have to face.

Ben, a staff member and pilot explained:

I don’t know [the number of flights] off the top of my head. If I recall correctly it is in the low thousands of ops. Like 2000-3000 over the course of the week that it is open.

Just to give you an idea of what it is like, I made 27 ops last year myself there are about 10 pilots who fly people around like I do. The ultralight guys do close to a hundred each. Then we have the charter ops, I have no idea how many of those there are but it is lots, and parachute operations and medivac… We had something like 160 planes on the field for the people who flew their own planes in.

It is pretty impressive, we spend most of the year planning and then put it all together in a week use it for a week and then tear it apart in a few days.

To the air boss, local and remotely accessible weather data is an important component.

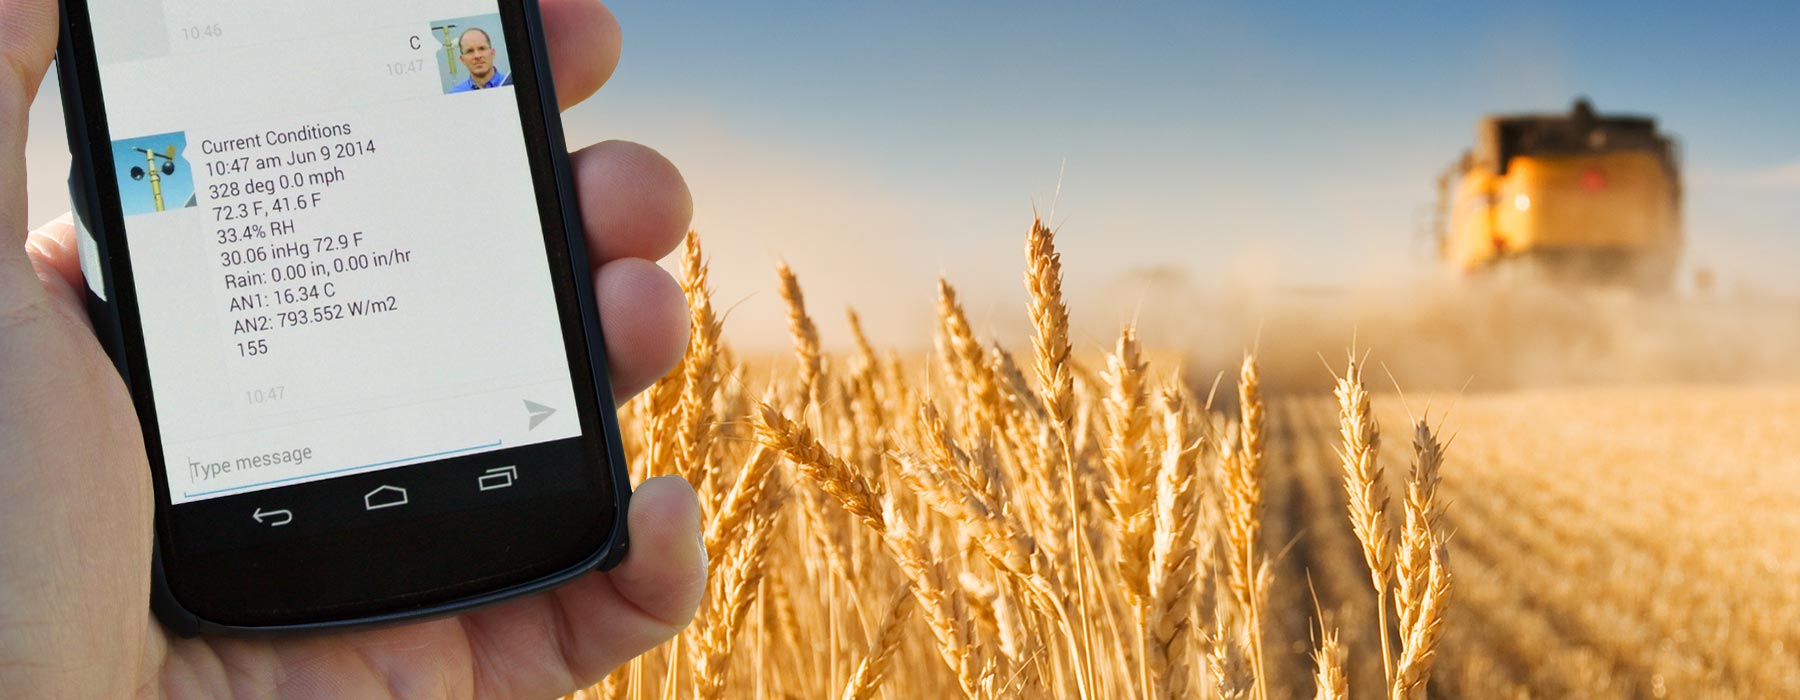
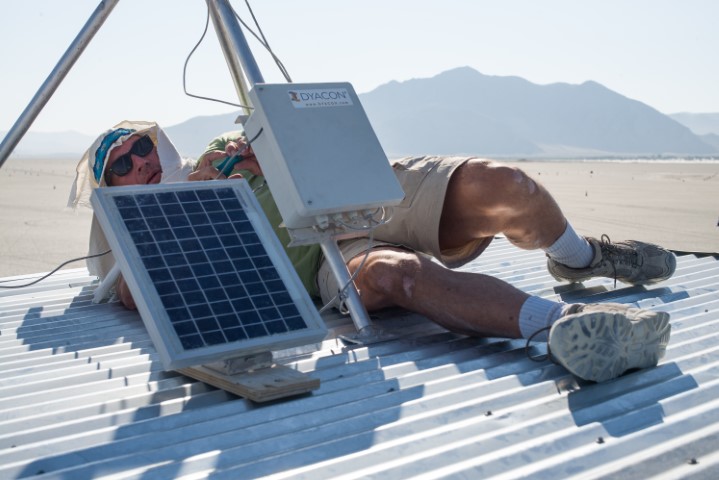
Dyacon weather stations provide surface weather data through a cable connection to a local PC while also sending data to DyaconLive and Weather Underground. Additionally, text messaging is used for weather reports, remote debugging, and configuration.

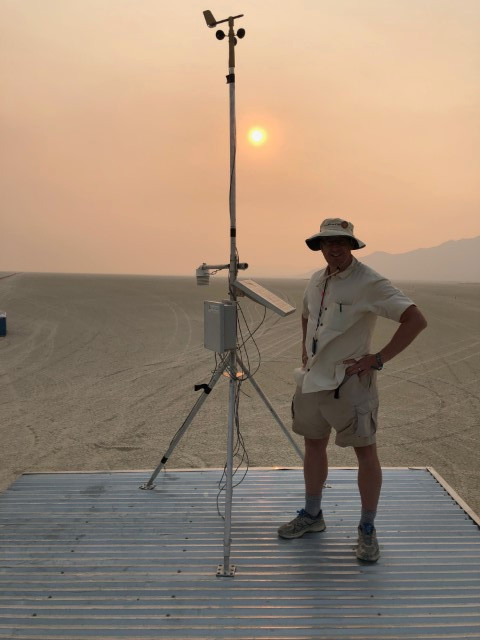
Burning Man first deployed a Dyacon station in 2017.

These stations are erected every year by their aviation staff and stored until the next year.

After sitting idle for the year, the 2017 station required a firmware update when it was deployed. This was easily done over-the-air, no programming tools, cables, or software utilities required, just a simple text message command.


The Burning Man staff do a remarkable job. We are proud to be a part of their dusty venture. (And we are glad that they now have two Dyacon stations serving their needs in 2018, one with cell phone and one on WiFi.)

Eugene