All Posts By

Eugene

Do you want your data log Emailed or FTP’d?

By Blog

What good is your weather station data if you need a degree in computer science to see it.

Automatic upload to WeatherUnderground has been a standard feature of Dyacon MS-100 weather stations from the beginning. Now, we add two new ways to get your full data set, email and FTP.

“Ah, but what special accessories or add-on modules do I need?”

None. The capability is built into MS-100 weather station control modules. No additional boxes to buy and no additional wiring. The feature uses the integrated cell phone of the MS-130, MS-140, and MS-150 weather stations.

“Do I have to pay more for the service?”

No. Other than a few more bytes of data traffic, there is no additional cost, no software license, server access fees, and no development tools to buy. It’s your weather station, your data, we’d like you to keep it that way.

Details

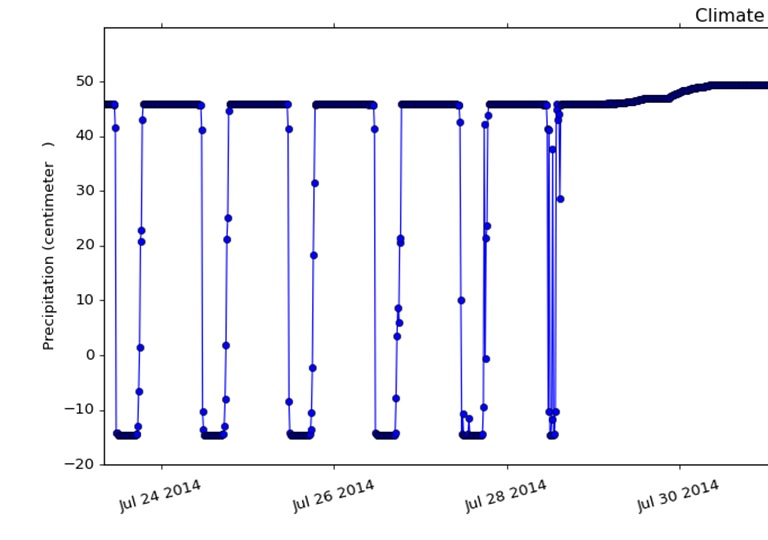
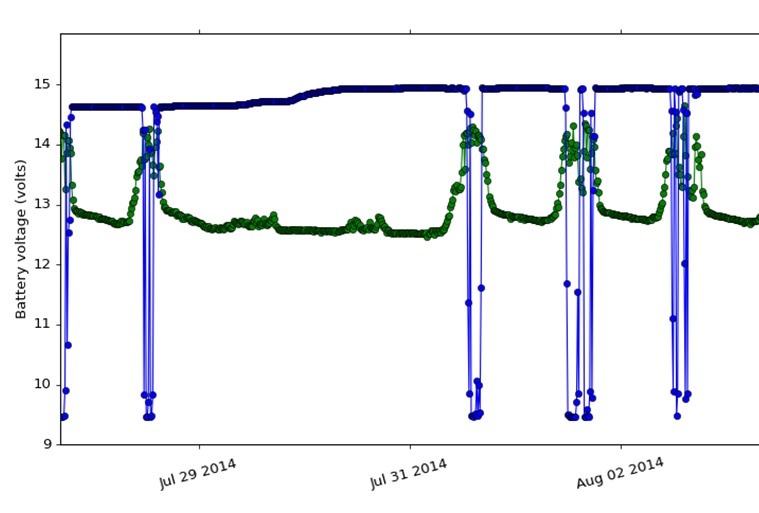
The data log can be programmed to transmit daily, weekly, or monthly. The log is transmitted as a CSV file and is uploaded directly to the FTP server or attached to an email. Each mode (email and FTP) is enabled separately.

The email address, server, and password are programmed through the LCD interface on the Dyacon control module (data logger), CM-1. The Dyacon Control Module Utility, which is free, may also be used for configuring the settings.

The phone module must be provisioned with an appropriate data plan. A dedicated IP address is NOT required. Low-cost machine-to-machine data plans are available from Dyacon or your international distributor.

Please give us a call if you have any questions.

Eugene

Rain Gauge Fixed with 12 V Regulator

By Blog

A friend came to me with a curious problem regarding the research weather stations he maintains. The Geonor rain gauges were experiencing glitches. Some of his stations exhibited only occasional problems, and others were failing almost daily.

In the plot below, the rain gauge output is in blue. It should be a steady, increasing line representing the weight of the accumulated precipitation. The green line is the battery voltage. In this case, when the sun would hit the solar panels each day, the solar charge controller turned on and the rain gauge stopped working.
Rain gauge output in blue. Solar panel output in green.

I found that the systems he maintains use a Morningstar Sunsaver solar charge controller. These solar charge controllers use a PWM output to charge the battery. This means that rather than just regulating the voltage and current to the battery, the controllers switch the charge voltage on and off very fast. This type of electrical signal can cause electrical noise and interfere with other devices on the circuit. Depending on the lengths of wires to the batteries and the susceptibility of other systems, the noise may become significant.

The Solution

After some testing, it was demonstrated that the PWM power from the solar charge controller was interfering with the vibrating wire signal adapter of the Geonor rain gauge. Adding a 12 VDC linear regulator to the circuit resolved the problem.

We quickly created a new product to address this problem. The regulator is now available as Dyacon RLP‑2WTM.

With an input range of 12.5 V to 36 V, RLP‑2W is also suitable for industrial automation applications. The On/Off control input of RLP‑2W allows for power optimization using a digital signal to control the regulator output.

Let us know if you have a specific problem with your data acquisition system. We’d love to see if we could help.

Eugene

Spinning Wind Sensor

Smart Sensor Benefits, Part II

By Blog

In part one of Smart Sensor Benefits I mentioned some advantages that digital sensors have when integrating them with data acquisition devices. They allow for easy integration by providing “ready-to-use” measurement data. The sensors can also provide a richer data set than can be achieved with an analog sensor. In the case of Dyacon WSD wind sensors, current and averaged wind parameters are available.

Now With Gust!

Utilizing the smart sensor processor, Dyacon can expand the functionality of WSD and TPH sensors. As an example, WSD-1 now calculates gust in addition to current measurements, 2 minute average, and 10 minute average.

That is much easier to work with than a 0 V to 5 V output!

Spinning Wind Sensor

How Far Will You Go?

Dyacon WSD-1 and TPH-1 sensors use Modbus RS-485. A recent article in an engineering trade journal, Design World, touted the advantages of RS-485. One of the valuable benefits is the ability to transmit over long cable lengths, 1500 ft to 6000 ft (450 m to 1830 m). These are rough values and depend on the data rate, cable type, and electrical environment.

The data rate on Dyacon Modbus sensors, WSD-1 and TPH-1, is selectable from 1200 bps up to 38400 bps. This feature allows users to optimize the data rate for the specific application, balancing power usage with connection reliability over long cable runs.

What Flavor Would You Like?

Dyacon has been building customized electronic products for integrators for many years. Systems often need to be optimized for particular applications in order to provide the necessary functional benefits or market differentiation. If you have a special need that requires a particular data set or protocol, give us a call. We would be happy to work with you to emulate another device, adapt measurement algorithms, or provide you with a unique solution for your application whether industrial automation, wind power survey, or environmental data acquisition.

Eugene

When it Pours

By Blog

A couple of weeks ago, I journeyed to Zion National Park for some hiking and canyoneering with some family. As luck would have it, the heavy rains that week spoiled our plans, at least that is the way it seemed. We had planned a hike in one of the canyons on the first day, but even minimal rain can inundate the canyons making it a deadly experience.

Flooded Virgin River in Zion National Park

Flooded Virgin River in Zion National Park

Canyon Showers

Canyon Showers

It is not uncommon to hear of people trapped or killed by flash floods in the slot canyons of southern Utah. There is often no way out, but down stream and it is best to go under your own power. Caution must be observed to check weather reports and forecasts for the surrounding areas. The high precipitation rate that we observed compounded the danger and caused damage to roads throughout the region.

So, we enjoyed a wet hike in the pouring rain as we worked our way to Angel’s Landing and arrived just as the sky cleared.

Image of Angel's Landing

Angel’s Landing

The following day we were fortunate enough to get a permit to hike, wade, swim, rappel, and scramble through The Subway.

The reward, a view of The Subway.

The reward, a view of The Subway.

Upstream view of The Subway.

Upstream view of The Subway.

Subway Canyon

Subway Canyon

…And My Point?

Automatic weather stations in areas where capturing high precipitation rates is critical, a standard tipping bucket gauge may be overwhelmed. As the rain rate increases, the measurement error also increases. RGTB-4TM from Dyacon is designed specifically for such conditions. Even with rates of 250 mm/hr to 500 mm/hr (10 in/hr to 20 in/hr) accuracy is +/-3%.

Rain Gauge

Rain Gauge

The Siphon

The problem with conventional tipping bucket gauges is that simple funnels do not provide a consistent flow rate into the mechanism. When the rain increases, the mechanism is flooded and either the error rate increases or the gauge stops working.

Rain gauge siphon flow control.

Rain gauge siphon flow control.

RGTB-4 uses a proven siphon mechanism to ensure consistency and accuracy even when the funnel has been filled with water by heavy rains.

…And That’s Not All!

RGTB-4 also has discharge ports which can be used to capture precipitation for later verification and analysis. Just run standard tubing into a closed container so you can validate gauge measurements in a controlled environment. What more could you want? . . . Well, maybe you’d better not answer that.

Eugene

Eugene in The Subway

Eugene in The Subway

Airshow Weather Station

By Aviation, Blog

Across the country, hundreds of small airports have little or no weather instrumentation. A simple wind sock might be the only indicator of surface conditions, as is the case for the runway in Preston, Idaho.

After nearly a year of preparation in Preston, an airshow was held on August 2, 2014 to raise funds to extend the runway. Prior to the airshow, I noticed that they lacked basic wind instruments, so my beautiful daughter helped me set up an MS-130 weather station near the runway. This station was connected to Weather Underground through the embedded cell phone and also provided SMS text message weather reports.

I would have loved to catch more video of the show, but I could only catch so much because I was sitting with the air boss, receiving quantitative wind data that was relayed to the pilots throughout the event. It was a great experience for me and added a level of sophistication to a small Idaho airport.

Fly safe.

Eugene

Wind sensor modbus

Dyacon Wind Sensor: Now Detecting Wind GUST!

By Blog

While sustained winds are of interest, it is the wind gusts that generally cause damage . . . at least for those outside of tornado alley or on hurricane coast.

How do you measure a gust? With a Dyacon wind sensor, of course.

The latest firmware for Dyacon WSD‑1 now gives users more measurement parameters than other wind sensors on the market.

  • Current wind speed
  • Current wind direction
  • 2 minute average wind speed
  • 2 minute average wind direction
  • 10 minute average wind speed
  • 10 minute average wind direction
  • and . . . gust

You get it all for the same price and the same operating current, <2 mA at 12 VDC. Now that’s a bargain! (Sorry, no free knife sets.)

Keep in mind that not all increases in wind speed represent a gust. Where other stations simply look for the maximum wind speed over a period of time, we implement a more technical definition. To meet the definition of a gust, we look for increases in wind speed of at least 10 knots (11.5 mph, or 5.1 m/s) above the 2 minute average. The gust value is retained for 10 minutes and replaced if a higher value occurs.
The sudden impact of a rapid change in wind is what often causes damage. After about 3 seconds, the structures are engulfed, and the pressure differential is reduced.

When it occurs, you’ll see this new value populated on my weather station at weatherunderground.com.

Eugene

Weather Underground Sticker

Your Weather Station on Your Website

By Blog

*NOTE: This blog post is out of date. Some information may no longer be relevant.*

Many users would like to add weather conditions to their website. Good news! There’s no need to call the web developer and launch into weeks’ worth of work. Instead, Weather Underground has some great “sticker” options, where you can just copy and paste a little code snippet to add it to your blog or website.

Where would this be useful? Some applications include, but certainly aren’t limited to, hotels, outdoor water parks, boat rentals/marinas, golf courses, public libraries, and road condition sites. A resort in Hawaii would do well to brag about their temperate conditions online while we in the northern hemisphere are prying our icy hands off snow shovels.

Dyacon Weather Stations upload directly to Weather Underground. The site from my backyard is below. When you create your Weather Underground account, the “Get Weather Sticker” options will become available to you.


Oh, you want metric? No problem. Simply paste in a different snippet.

Not big enough? How about the following?

And it’s all done without an application engineer’s writing code for a black box data logger, add-on modules, or additional web servers . . . and without any extra fees. The developers at Weather Underground are my new friends. They might even get a Christmas card from me this year.

Eugene

Smart Sensor Benefits, Part 1

By Blog

Simple analog sensors require the host device to perform a number of calculations to correctly scale the inputs, check for errors, and convert to usable measurement units. Similarly, sensor measurements are typically averaged over several seconds, minutes, or hours in order to present useful measurements of conditions and trends. Instantaneous measurements can be misleading or jump around too much to be useful and must be averaged and limit controlled to minimize the inherent noise.

All of these calculations put a burden on the host device and the software developer. For applications such as PLCs, embedded devices, and computer software applications, analog sensors require the programmer to have an in-depth knowledge of sensor output, measurement characteristics, and weather parameters.

With an ever-present focus to keep things simple and user-friendly, Dyacon WSD‑1 and TPH‑1 present usable digital data to the host device. For example, wind speed can be used directly by the developer without the need to count pulses or scale the voltage and then test, average, and convert the output.

Dyacon WSD-1 and TPH-1 go a step beyond other digital sensors in that both sensors provide additional calculated values:

TPH-1 gives temperature, pressure, and humidity measurements. Output values have been sampled multiple times, checked, and averaged. As of the latest firmware version, a value for a 3 hour barometric pressure trend is also given.

WSD-1 provides wind speed and direction data. Similarly, these measurements are sampled multiple times, checked, and averaged to provide a current measurement. Extended data are now available, which give 2 minute and 10 minute averages of wind speed and wind direction. The 10 minute average is the typical period for weather reports. Other applications may find the current or 2 minute average values to be more practical.

The extended calculations of trend, 2 minute average, and 10 minute average are done along with other data processing on the Dyacon sensors. Since the sensors are specifically optimized for the target measurements, there is no significant power penalty for the extended measurement data. Low power applications, such as environmental data loggers, can reduce their overall system power budget with Dyacon sensors. The data logger can wake, store data, and return to sleep without having to collect multiple analog samples and perform the related calculations.

Creative management of limited power resources is very exciting stuff for us geeks. Oh, what fun! 😉

Eugene

Graphic Weather Data

Weather Underground

By Blog, Homepage, Weather Underground

Getting your weather data where you need it, when you need it is a priority for many private weather station users. Several Dyacon banner images feature a text message weather report, the advantages of which I will write about in another post. However, when you have a large number of users, a web interface is preferred.

Dyacon MS-130, MS-140, and MS-150 weather stations have an integrated cell phone. Using a low-cost data plan, these units are capable of not only sending SMS text message reports to your phone, but they can also upload data to your own Weather Underground account. Data from the Newton South Dyacon weather station is available at http://www.wunderground.com/personal-weather-station/dashboard?ID=KUTNEWTO2#history. Below is a sample of the Weather Underground history page.

Weather Underground Graphic Weather Data

Newton South – Dyacon.com Weather Underground Weather Data

The Dyacon Newton South weather station represents the MS-150 configuration. It includes the following:

  • Wind speed
  • Wind direction
  • Air temperature
  • Barometric pressure
  • Relative humidity
  • Solar sensor
  • Soil temperature
  • Rain gauge
  • Solar power
  • Cell phone
  • Data logger
  • Lightning detection
  • GPS receiver (future option)
Weather Underground Compatible Dyacon Newton South Weather Station

Weather Underground Compatible    Newton South Weather Station

Several of our stations are visible on the Dyacon Weather Stations page.
Eugene

Special Event Weather Stations

By Blog

Special events, such as athletic and motor races, large group camps, or outdoor meetings, can pose challenges for organizers as they try to manage resources and prepare for hazardous weather. High winds, cold temperatures, and lightning are common in our area and can increase the risk of injury. Similarly, high temperatures or high humidity can lead to deadly heat injuries.

Here in northern Utah, races such as Lotoja and Ragnar Relay pass through sparsely populated areas and high altitudes. Rapidly changing weather conditions can jeopardize the safety of participants, support crew, and staff, especially when the route may not be easily accessible to evacuation resources.

Dyacon weather stations can be temporarily deployed to key locations to provide quantitative information regarding changing weather conditions in advance of and during special events. Support crews may call in “cold” conditions, but actual weather data can help remove ambiguities and provide a concrete basis for management decisions.

Weather station on Willard peak.

Last week, I had an opportunity to help conduct a large group outdoor activity. Several climbing instructors and I provided an opportunity for 60 youth to take on a 150 ft (50 m) rappel. The venue was at 9200 ft (2800 m) altitude. While this altitude is not extreme, it did provide an opportunity to deploy a Dyacon MS-130 to monitor conditions at the peak while we conducted the group activity 300 feet below.

Event operators can receive weather reports via SMS text message or through Weather Underground. SMS is universally compatible with mobile phones and can be accessed in areas of marginal cell phone coverage.

If you are conducting an event and would like to utilize a Dyacon weather station, please give us a call. We would be happy to support your event.

Eugene